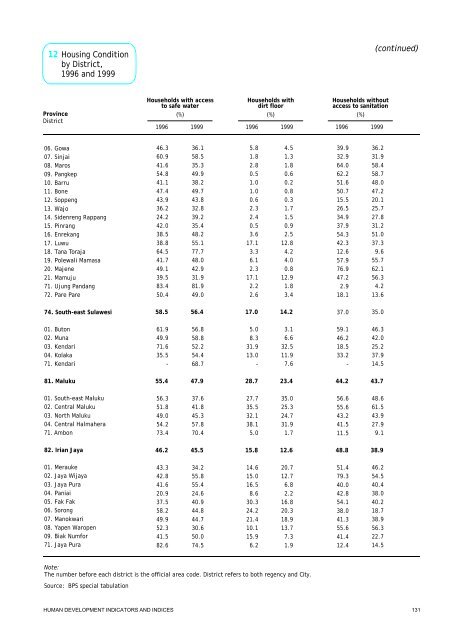
12 Housing ConditionbyDistrict,1996 and1999(continued)ProvinceDistrictHouseholdswith accessto safe waterHouseholdswithdirtfloor(%) (%)1996 1999 1996 1999Householdswithoutaccess to sanitation(%)1996 199906.Gowa07.Sinjai08.Maros09.Pangkep10.Barru11.Bone12.Soppeng13.Wajo14.Sidenreng Rappang15.Pinrang16.Enrekang17.Luwu18.TanaToraja19.Polewali Mamasa20.Majene21.Mamuju71.UjungPandang72.Pare Pare46.360.941.654.841.147.443.936.224.242.038.538.864.541.749.139.583.450.436.158.535.349.938.249.743.832.839.235.448.255.177.748.042.931.981.949.05.81.82.80.51.01.00.62.32.40.53.617.13.36.12.317.12.22.64.51.31.80.60.20.80.31.71.50.92.512.84.24.00.812.91.83.439.932.964.062.251.650.715.526.534.937.954.342.312.657.976.947.22.918.136.231.958.458.748.047.220.125.727.831.251.037.39.655.762.156.34.213.674.South-east Sulawesi58.556.417.014.237.035.001.Buton02.Muna03.Kendari04.Kolaka71.Kendari61.949.971.635.5-56.858.852.254.468.75.08.331.913.0-3.16.632.511.97.659.146.218.533.2-46.342.025.237.914.581.Maluku55.447.928.723.444.243.701.South-eastMaluku02.Central Maluku03.North Maluku04.Central Halmahera71.Ambon56.351.849.054.273.437.641.845.357.870.427.735.532.138.15.035.025.324.731.91.756.655.643.241.511.548.661.543.927.99.182.IrianJaya46.245.515.812.648.838.901.Merauke02.Jaya Wijaya03.Jaya Pura04.Paniai05.Fak Fak06.Sorong07.Manokwari08.Yapen Waropen09.Biak Numfor71.Jaya Pura43.342.841.620.937.558.249.952.341.582.634.255.855.424.640.944.844.730.650.074.514.615.016.58.630.324.221.410.115.96.220.712.76.82.216.820.318.913.77.31.951.479.340.042.854.138.041.355.641.412.446.254.540.438.040.218.738.956.322.714.5Note:The number before each districtisthe official area code.Districtrefers to both regencyand City.Source: BPS special tabulationHUMAN DEVELOPMENTINDICATORSAND INDICES 131
ProvinceDistrict11.Aceh12.North Sumatera13.WestSumatera01.SouthAceh02.South-eastAceh03.EastAceh04.CentralAceh05.WeastAceh06.Aceh Besar07.Pidie08.NorthAceh71.BandaAceh72.Sabang01.Nias02.SouthTapanuli03.Central Tapanuli04.NorthTapanuli05.Labuhan Batu06.Asahan07.Simalungun08.Dairi09.Karo10.DeliSerdang11.Langkat71.Sibolga72.Tanjung Balai73.Pematang Siantar74.TebingTinggi75.Medan76.Binjai01.South Pesisir02.Solok03.Sawah Lunto/Sijunjun04.Tanah Datar05.Padang Pariaman06.Agam07.Limapuluh Koto08.Pasaman71.Padang72.Solok73.Sawah Lunto74.Padang Panjang75.BukitTinggi76.PayakumbuhReal percapitaGRDPin 1998 a)Annual growth in real per capita GRDP(Thousand Rupiah) (%)6.29.46.96.66.17.04.46.57.66.46.71.67.88.89.87.66.66.89.27.57.811.324.311.816.95.85.98.55.07.55.15.34.66.76.99.86.33.86.25.122.46.87.56.45.76.96.15.96.36.54.66.77.56.16.1-0.37.15.06.08.77.29.39.12.69.68.04.18.416.48.74.34.87.57.35.66.04.66.97.26.96.65.16.44.6-2.57.37.46.63.45.43.54.43.93.52.44.14.44.84.1-3.05.82.53.53.55.77.17.75.35.57.55.83.64.56.45.31.75.60.32.83.12.14.33.83.93.62.23.71.80.93.24.33.5-7.4-9.4-6.9-4.93.7-9.5-1.4-4.2-2.3-5.7-10.2-14.7-2.8-7.2-10.3-6.2-7.2-1.5-0.8-3.61.6-6.0-8.7-4.1-8.8-8.7-5.7-14.1-21.8-14.9-6.1-5.3-6.0-5.3-5.3-4.5-6.1-5.1-9.8-6.9-10.0-5.7-7.9-5.6-10.8-9.4-6.9-4.93.7-10.5-1.4-4.2-2.3-5.7-13.6-14.7-2.8-7.2-10.3-6.2-7.2-1.5-0.8-3.61.6-6.0-8.7-4.3-8.8-8.7-5.7-14.1-21.8-14.9-6.1-5.3-6.0-5.3-5.3-4.5-6.1-5.1-9.8-6.9-10.0-5.7-7.9-5.6-1.94.23.54.43.9-2.82.44.14.44.8-3.9-3.05.82.53.53.55.77.17.75.35.57.55.8-9.74.56.45.31.75.60.32.83.12.14.33.83.93.62.23.71.80.93.24.33.50.66.76.15.96.33.94.66.77.56.1-1.8-0.37.15.06.08.77.29.39.12.69.68.04.15.916.48.74.34.87.57.35.66.04.66.97.26.96.65.16.44.6-2.57.37.46.6-0.99.26.96.66.14.24.46.57.66.4-4.11.67.88.89.87.66.66.89.27.57.811.324.38.816.95.85.98.55.07.55.15.34.66.76.99.86.33.86.25.122.46.87.56.4EconomicPerformancebyDistrict,199913with oiland gaswithoutoil andgaswith oilandgaswithoutoilandgas1995 19951996 19961997 19971998 19981,5091,9641,6781,2771,1501,4431,9161,2971,7821,2451,8711,1872,1331,1641,5891,6411,4682,4602,8812,1261,4282,4411,4861,8662,6652,9342,7622,.2172,3221,3271,0281,1711,5721,3931,4381,5191,7459712,9801,9513,8562,0542,0991,7152,5481,9761.6781,2771,1501,5161,9161,2971,7821,2456,0281,1872,1331,1641,5891,6411,4682,4602,8812,1261,4282,4411,4862,0302,6652,9342,7622,2172,3221.3271,0281,1711,5721,3931,4381,5191,7459712,9801,9513,8562,0542,0991,715INDONESIAHUMAN DEVELOPMENT REPORT<strong>2001</strong>132