Radio Science Bulletin 313 - June 2005 - URSI
Radio Science Bulletin 313 - June 2005 - URSI
Radio Science Bulletin 313 - June 2005 - URSI
- No tags were found...

Create successful ePaper yourself
Turn your PDF publications into a flip-book with our unique Google optimized e-Paper software.
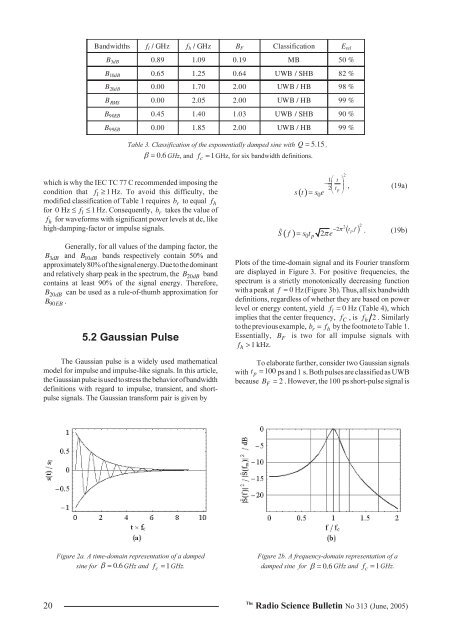
Bandwidths f l / GHz f h / GHz B F Classification E relB 3dB 0.89 1.09 0.19 MB 50 %B 10dB 0.65 1.25 0.64 UWB / SHB 82 %B 20dB 0.00 1.70 2.00 UWB / HB 98 %B RMS 0.00 2.05 2.00 UWB / HB 99 %B 90EB 0.45 1.40 1.03 UWB / SHB 90 %B 99EB 0.00 1.85 2.00 UWB / HB 99 %Table 3. Classification of the exponentially damped sine with Q = 5.15 ,β = 0.6 GHz, and f = 1GHz, for six bandwidth definitions.cwhich is why the IEC TC 77 C recommended imposing thecondition that fl≥ 1 Hz. To avoid this difficulty, themodified classification of Table 1 requires b r to equal f hfor 0 Hz ≤ f l ≤1Hz. Consequently, b r takes the value off h for waveforms with significant power levels at dc, likehigh-damping-factor or impulse signals.Generally, for all values of the damping factor, theB 3dB and B 10dB bands respectively contain 50% andapproximately 80% of the signal energy. Due to the dominantand relatively sharp peak in the spectrum, the B 20dB bandcontains at least 90% of the signal energy. Therefore,B 20dB can be used as a rule-of-thumb approximation forB .90EB5.2 Gaussian PulseThe Gaussian pulse is a widely used mathematicalmodel for impulse and impulse-like signals. In this article,the Gaussian pulse is used to stress the behavior of bandwidthdefinitions with regard to impulse, transient, and shortpulsesignals. The Gaussian transform pair is given by()s t21⎛t ⎞− 2⎜t⎟⎝ p ⎠0= s e2S ˆ ( f)= s0tp2 π e − π, (19a)2( ) 2tpf. (19b)Plots of the time-domain signal and its Fourier transformare displayed in Figure 3. For positive frequencies, thespectrum is a strictly monotonically decreasing functionwith a peak at f = 0 Hz (Figure 3b). Thus, all six bandwidthdefinitions, regardless of whether they are based on powerlevel or energy content, yield f l = 0 Hz (Table 4), whichimplies that the center frequency, f C , is f h 2 . Similarlyto the previous example, b r = f h by the footnote to Table 1.Essentially, B F is two for all impulse signals withf > 1 kHz.hTo elaborate further, consider two Gaussian signalst = ps and 1 s. Both pulses are classified as UWBB = . However, the 100 ps short-pulse signal iswith 100 pbecause 2 FFigure 2a. A time-domain representation of a dampedsine for β = 0.6 GHz and f c = 1GHz.Figure 2b. A frequency-domain representation of adamped sine for β = 0.6 GHz and f c = 1GHz.20The<strong>Radio</strong> <strong>Science</strong> <strong>Bulletin</strong> No <strong>313</strong> (<strong>June</strong>, <strong>2005</strong>)