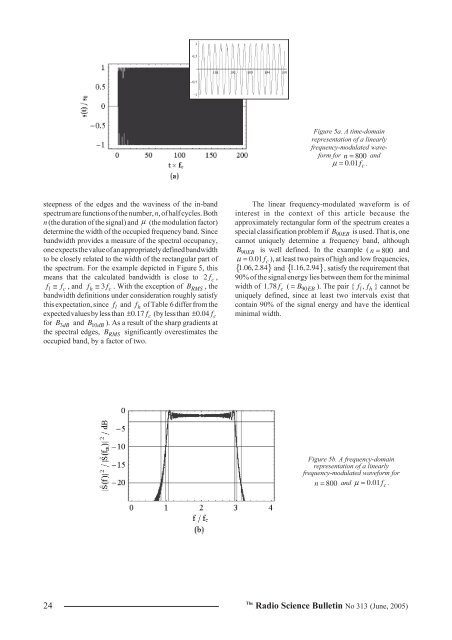
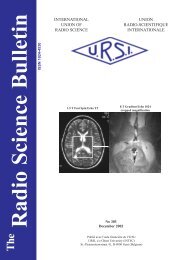
Figure 5a. A time-domainrepresentation of a linearlyfrequency-modulated waveformfor n = 800 andµ = 0.01 f c .steepness of the edges and the waviness of the in-bandspectrum are functions of the number, n, of half cycles. Bothn (the duration of the signal) and µ (the modulation factor)determine the width of the occupied frequency band. Sincebandwidth provides a measure of the spectral occupancy,one expects the value of an appropriately defined bandwidthto be closely related to the width of the rectangular part ofthe spectrum. For the example depicted in Figure 5, thismeans that the calculated bandwidth is close to 2 f c ,fl≅ fc, and fh≅ 3 fc. With the exception of B RMS , thebandwidth definitions under consideration roughly satisfythis expectation, since f l and f h of Table 6 differ from theexpected values by less than ± 0.17 f c (by less than ± 0.04 f cfor B 3dB and B 10dB ). As a result of the sharp gradients atthe spectral edges, B RMS significantly overestimates theoccupied band, by a factor of two.The linear frequency-modulated waveform is ofinterest in the context of this article because theapproximately rectangular form of the spectrum creates aspecial classification problem if B 90EB is used. That is, onecannot uniquely determine a frequency band, althoughB 90EB is well defined. In the example ( n = 800 andµ = 0.01 f c ), at least two pairs of high and low frequencies,{ 1.06,2.84 } and { 1.16,2.94 }, satisfy the requirement that90% of the signal energy lies between them for the minimalwidth of 1.78 f c ( = B90EB). The pair { fl,f h } cannot beuniquely defined, since at least two intervals exist thatcontain 90% of the signal energy and have the identicalminimal width.Figure 5b. A frequency-domainrepresentation of a linearlyfrequency-modulated waveform forn = 800 and µ = 0.01 f c .24The<strong>Radio</strong> <strong>Science</strong> <strong>Bulletin</strong> No <strong>313</strong> (<strong>June</strong>, <strong>2005</strong>)
Bandwidth f l / f c f h / f c B F Classification E relB 3dB 1.04 2.96 0.96 UWB / SHB 97.21 %B 10dB 0.97 3.02 1.03 UWB / SHB 99.16 %B 20dB 0.83 3.14 1.16 UWB / SHB 99.83 %B RMS 0.18 3.82 1.82 UWB / HB 99.91 %B 90EB 1.06 2.84 0.92 UWB / SHB 90 %1.16 2.94 0.87 UWB / SHB 90 %B 99EB 0.98 3.02 1.01 UWB / SHB 99%Table 6. Classification of the LFM waveform with n = 800 and µ = 0.01 f cfor six bandwidth definitions.6. Challenging QuestionsAlthough the four test signals evaluated in this paperare considered well behaved, they pose challenging problemsfor the articulated bandwidth definitions and classificationschemes. For example, two very different signals can beclassified as hyperband (UWB): (1) an impulse-like 10 psGaussian signal with a bandwidth, B, in the tens of GHz anda lower frequency of 0 Hz (set t p = 10 ps in Table 4); and(2) an extremely long duration pulse with a nearly flatmagnitude spectrum and B on the order of a few Hz (a linearfrequency-modulated signal with a very large number, n, ofhalf cycles and a very low chirp rate, µ ). That these twoextremes would belong to the same category perhapssuggests the need for a general classification scheme withmore than one parameter to distinguish signal types, if ascheme is to be applicable for arbitrary signals andapplications. Typically, UWB has been associated withshort-pulse signals only: a large number of articles andstandardization publications discuss UWB only with regardto short-pulse signals. In contrast, the proposed UWBdefinition and classification scheme does not require thefrequency range to be completely occupied and,consequently, non-impulsive signals may be UWB.Many bandwidth definitions suffer from not beingwell defined for an arbitrary waveform. It is unclear whethera specific bandwidth definition exists for each waveform.In the case of a rectangular spectrum with a beginningfrequency f b and an ending frequency f e , the energybandwidth B 90EB is equal to 0.9( fe − fb), because anyinterval with a width of 0.9( fe − fb)contains 90% of thesignal energy. However, the power-level bandwidth BXdBis not defined for X > 0 , since no horizontal line intersectsthe power spectral density, except for X = 0 . AlthoughB 90EB is uniquely determined, the fractional bandwidthand the band ratio are not defined, because many f l inf , f 0.9ff − f = 0.9 f − f .[ + ] satisfy ( ) ( )b b eh l e bAnother problematic issue arises when signal spectrawith notches or multiple peaks cause trouble for the powerlevelbandwidth definitions, since the chosen power levelmay intersect the magnitude spectrum at more than twopoints. Even if the fractional energy bandwidth is uniquelydefined for this kind of signal spectrum, its interpretation isnot without problems. Specifically, a nonuniformdistribution of the notches and peaks can induce a nonuniformenergy distribution over the frequency band, andconsequently signals with identical energy-bandwidth valuescould significantly differ. For example, the notches of onesignal could match the peaks of a second signal, and visaversa. One means for addressing this issue would be tointroduce a parameter (peak-to-valley ratio) that describesthe ripple content or waviness of the magnitude spectrumwithin a specified band.Finally, a parameter that has been ignored by UWBdefinitions and classification schemes is the phase spectrum.This omission may be acceptable for the classification ofsignals, but phase plays an important role in describing andcharacterizing devices. In this vein, one might want toquantify the goodness of a UWB device by specifying howclosely the magnitude and phase of the device’s transferfunction approximate constant and linear functions,respectively. This goodness criterion is equivalent toquantifying how closely a device’s output matches its input.One possible means of quantifying this goodness is tocalculate the fidelity [15] between the input and outputsignals.Deeper discussions of these challenging questions,as well as treating less ideal signals like spectra with wideenergy spreads and medium strong peaks, are the subject offuture research.7. SummaryThis article has discussed the definition andclassification of UWB signals and devices in terms offrequency coverage and bandwidth. Three apparently similarUWB classification schemes have been compared, and thedifferences in how they define bandwidth and categorizationcriteria have been highlighted. After analyzing theThe<strong>Radio</strong> <strong>Science</strong> <strong>Bulletin</strong> No <strong>313</strong> (<strong>June</strong>, <strong>2005</strong>) 25
- Page 1 and 2: Radio Science BulletinISSN 1024-453
- Page 3 and 4: EditorialJune in December?Yes, this
- Page 5 and 6: URSI Accounts 2004In 2004, a year p
- Page 7 and 8: EURO EUROA2) Routine Meetings 7,315
- Page 9 and 10: URSI AWARDS 2005The URSI Board of O
- Page 11 and 12: Guest Editors’ RemarksOn February
- Page 13 and 14: UWB and the corresponding signal pa
- Page 15 and 16: Radar / CommunicationsBand TypeElec
- Page 17 and 18: of the spectrum is required to comp
- Page 19 and 20: Bandwidths f l / GHz f h / GHz B F
- Page 21 and 22: Figure 3a. A time-domain representa
- Page 23: Bandwidths f l / f c f h / f c B F
- Page 27 and 28: Quantitative Comparison BetweenMatr
- Page 29 and 30: Next, construct the ‘filtered’
- Page 31 and 32: whereH[ P ] [ U][ ][ V] ,N= Σ (27)
- Page 33 and 34: CPU Time [sec]250200150100MPMSS1SS2
- Page 35 and 36: -10-20MPMSS1SS2-30-40RMSE [dB]-50-6
- Page 37 and 38: RMSE [dB]-45-50-55-60-65-70MPMSS1SS
- Page 39 and 40: An Ultra-Compact Impulse-Radiating
- Page 41 and 42: Figure 3. UCIRA-1 splitter/balun.th
- Page 43 and 44: Figure 9. UCIRA-2 in stowed configu
- Page 45 and 46: activated first in the deployment s
- Page 47 and 48: Figure 20. Theoretical gain ofUCIRA
- Page 49 and 50: Triennial Reports CommissionsCOMMIS
- Page 51: y the Special Section Editors, and
- Page 55 and 56: 3.2 Activities of URSI-Commission C
- Page 57 and 58: It already has been decided that th
- Page 59 and 60: SCOR (Scientific Committee on Ocean
- Page 61 and 62: COMMISSION GThis triennium report w
- Page 63 and 64: GNSS-LEO occultation is a very impo
- Page 65 and 66: CPEA Contacts: Shoichiro Fukao, Pro
- Page 67 and 68: The group wishes to continue as an
- Page 69 and 70: total of 109 oral papers (24 thereo
- Page 71 and 72: surface, to compensate for the rema
- Page 73 and 74: XXVIIIth General AssemblyNEWLY ELEC
- Page 75 and 76:
Décide1. d’accepter l’invitati
- Page 77 and 78:
satellite observation, bottomside s
- Page 79 and 80:
ETTC ‘05EUROPEAN TEST AND TELEMET
- Page 81 and 82:
IRI 2005 WORKSHOPNEW SATELLITE AND
- Page 83 and 84:
financial and logistics issues conn
- Page 85 and 86:
CONFERENCE ANNOUNCEMENTS36 TH COSPA
- Page 87 and 88:
December 2006APMC 2006 - 2006 Asia-
- Page 89 and 90:
The Journal of Atmospheric and Sola
- Page 91 and 92:
SCIENTIFIC COMMISSIONSCommission A
- Page 93 and 94:
Commission E : Electromagnetic Nois
- Page 95 and 96:
Commission J : Radio AstronomyChair
- Page 97 and 98:
URSI MEMBER COMMITTEESAUSTRALIA Pre
- Page 99 and 100:
ALPHABETICAL INDEX AND CO-ORDINATES
- Page 101 and 102:
BRUSSAARD, Prof. dr.ir. G., Radicom
- Page 103 and 104:
FEICK, Dr. R., Depto. de Electronic
- Page 105 and 106:
SAUDI ARABIA, Tel. +966 1-4883555/4
- Page 107 and 108:
E-mail loulee@nspo.gov.tw (94)LEE,
- Page 109 and 110:
O’DROMA, Dr. M., Dept. of Electri
- Page 111 and 112:
+30 2310 998161, Fax +30 2310 99806
- Page 113 and 114:
TURSKI, Prof. A., ul. Krochmalna 3
- Page 115 and 116:
Information for authorsContentThe R