Radio Science Bulletin 313 - June 2005 - URSI
Radio Science Bulletin 313 - June 2005 - URSI
Radio Science Bulletin 313 - June 2005 - URSI
- No tags were found...

Create successful ePaper yourself
Turn your PDF publications into a flip-book with our unique Google optimized e-Paper software.
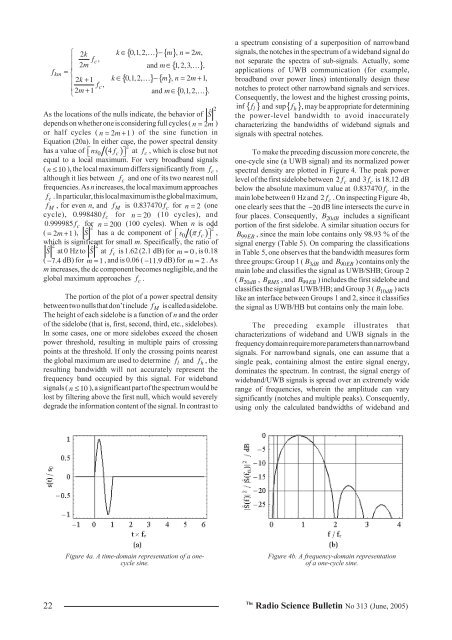
fkm∈{ 0,1,2, !} − { }, = 2 ,m ∈{ !}{ 0,1,2, !} { }, 2 1,m { !}⎧ 2k k m n m⎪ f c,⎪ 2 mand 1,2,3, ,= ⎨⎪ 2k+ 1 k∈ − m n = m+⎪fc,⎩2m+ 1 and ∈ 0,1,2, .As the locations of the nulls indicate, the behavior of Ŝdepends on whether one is considering full cycles ( n = 2m)or half cycles ( n = 2m+ 1) of the sine function inEquation (20a). In either case, the power spectral densityhas a value of ⎡⎣ns( ) 20 4 f c ⎤⎦ at f c , which is close but notequal to a local maximum. For very broadband signals( n ≤ 10 ), the local maximum differs significantly from f c ,although it lies between f c and one of its two nearest nullfrequencies. As n increases, the local maximum approachesf c . In particular, this local maximum is the global maximum,f M , for even n, and f M is 0.837470 f c for n = 2 (onecycle), 0.998480 f c for n = 20 (10 cycles), and0.999985 f c for n = 200 (100 cycles). When n is odd2( = 2m+ 1),Ŝ has a dc component of ⎡⎣s( ) 20 π fc⎤⎦ ,which is significant for small m. Specifically, the ratio of22Ŝ at 0 Hz to Ŝ at f c is 1.62 (2.1 dB) for m = 0 , is 0.18( −7.4dB) for m = 1 , and is 0.06 ( −11.9dB) for m = 2 . Asm increases, the dc component becomes negligible, and theglobal maximum approaches f c .2The portion of the plot of a power spectral densitybetween two nulls that don’t include f M is called a sidelobe.The height of each sidelobe is a function of n and the orderof the sidelobe (that is, first, second, third, etc., sidelobes).In some cases, one or more sidelobes exceed the chosenpower threshold, resulting in multiple pairs of crossingpoints at the threshold. If only the crossing points nearestthe global maximum are used to determine f l and f h , theresulting bandwidth will not accurately represent thefrequency band occupied by this signal. For widebandsignals ( n ≤ 10 ), a significant part of the spectrum would belost by filtering above the first null, which would severelydegrade the information content of the signal. In contrast toa spectrum consisting of a superposition of narrowbandsignals, the notches in the spectrum of a wideband signal donot separate the spectra of sub-signals. Actually, someapplications of UWB communication (for example,broadband over power lines) intentionally design thesenotches to protect other narrowband signals and services.Consequently, the lowest and the highest crossing points,{ f } and sup{ f }inf lh , may be appropriate for determiningthe power-level bandwidth to avoid inaccuratelycharacterizing the bandwidths of wideband signals andsignals with spectral notches.To make the preceding discussion more concrete, theone-cycle sine (a UWB signal) and its normalized powerspectral density are plotted in Figure 4. The peak powerlevel of the first sidelobe between 2 f c and 3 f c is 18.12 dBbelow the absolute maximum value at 0.837470 f c in themain lobe between 0 Hz and 2 f c . On inspecting Figure 4b,one clearly sees that the −20dB line intersects the curve infour places. Consequently, B 20dB includes a significantportion of the first sidelobe. A similar situation occurs forB 99EB , since the main lobe contains only 98.93 % of thesignal energy (Table 5). On comparing the classificationsin Table 5, one observes that the bandwidth measures formthree groups: Group 1 ( B 3dB and B 90EB ) contains only themain lobe and classifies the signal as UWB/SHB; Group 2( B 20dB , B RMS , and B 99EB ) includes the first sidelobe andclassifies the signal as UWB/HB; and Group 3 ( B 10dB ) actslike an interface between Groups 1 and 2, since it classifiesthe signal as UWB/HB but contains only the main lobe.The preceding example illustrates thatcharacterizations of wideband and UWB signals in thefrequency domain require more parameters than narrowbandsignals. For narrowband signals, one can assume that asingle peak, containing almost the entire signal energy,dominates the spectrum. In contrast, the signal energy ofwideband/UWB signals is spread over an extremely widerange of frequencies, wherein the amplitude can varysignificantly (notches and multiple peaks). Consequently,using only the calculated bandwidths of wideband andFigure 4a. A time-domain representation of a onecyclesine.Figure 4b. A frequency-domain representationof a one-cycle sine.22The<strong>Radio</strong> <strong>Science</strong> <strong>Bulletin</strong> No <strong>313</strong> (<strong>June</strong>, <strong>2005</strong>)