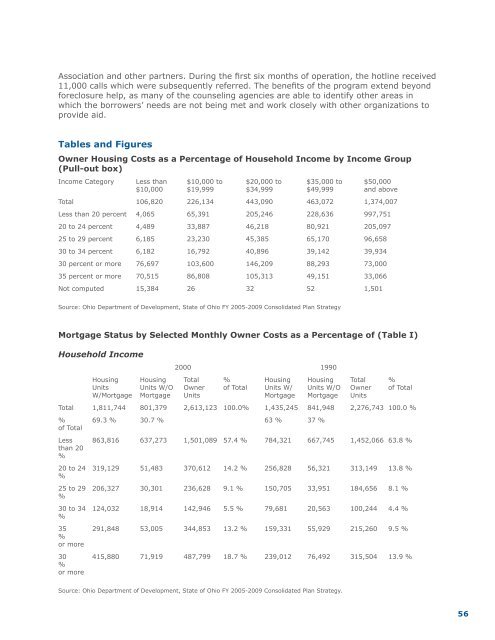
Association and other partners. During the first six months of operation, the hotline received11,000 calls which were subsequently referred. The benefits of the program extend beyondforeclosure help, as many of the counseling agencies are able to identify other areas inwhich the borrowers’ needs are not being met and work closely with other organizations toprovide aid.Tables and FiguresOwner <strong>Housing</strong> Costs as a Percentage of Household Income by Income Group(Pull-out box)Income Category Less than $10,000 to $20,000 to $35,000 to $50,000$10,000 $19,999 $34,999 $49,999 and aboveTotal 106,820 226,134 443,090 463,072 1,374,007Less than 20 percent 4,065 65,391 205,246 228,636 997,75120 to 24 percent 4,489 33,887 46,218 80,921 205,09725 to 29 percent 6,185 23,230 45,385 65,170 96,65830 to 34 percent 6,182 16,792 40,896 39,142 39,93430 percent or more 76,697 103,600 146,209 88,293 73,00035 percent or more 70,515 86,808 105,313 49,151 33,066Not computed 15,384 26 32 52 1,501Source: <strong>Ohio</strong> Department of Development, State of <strong>Ohio</strong> FY 2005-2009 Consolidated <strong>Plan</strong> StrategyMortgage Status by Selected Monthly Owner Costs as a Percentage of (Table I)Household Income2000 1990<strong>Housing</strong> <strong>Housing</strong> Total % <strong>Housing</strong> <strong>Housing</strong> Total %Units Units W/O Owner of Total Units W/ Units W/O Owner of TotalW/Mortgage Mortgage Units Mortgage Mortgage UnitsTotal 1,811,744 801,379 2,613,123 100.0% 1,435,245 841,948 2,276,743 100.0 %% 69.3 % 30.7 % 63 % 37 %of TotalLess 863,816 637,273 1,501,089 57.4 % 784,321 667,745 1,452,066 63.8 %than 20%20 to 24 319,129 51,483 370,612 14.2 % 256,828 56,321 313,149 13.8 %%25 to 29 206,327 30,301 236,628 9.1 % 150,705 33,951 184,656 8.1 %%30 to 34 124,032 18,914 142,946 5.5 % 79,681 20,563 100,244 4.4 %%35 291,848 53,005 344,853 13.2 % 159,331 55,929 215,260 9.5 %%or more30 415,880 71,919 487,799 18.7 % 239,012 76,492 315,504 13.9 %%or moreSource: <strong>Ohio</strong> Department of Development, State of <strong>Ohio</strong> FY 2005-2009 Consolidated <strong>Plan</strong> Strategy.56
Estimated Units in Need of Some Form of Rehabilitation (Table II)Owner UnitsBuilt 1990 Built 1980 Built 1970 Built 1960 Built 1950 Built 1940 Built 1939 Estimated into 2000 to 1989 to1979 to 1969 to 1959 to 1949 or earlier Need ofRehabilitationTotal 453,415 281,709 447,647 424,434 527,146 260,902 677,261 556,5151, det. or 392,159 233,137 385,150 397,158 517,404 253,518 640,686 533,335attached2 to 4 6,290 4,349 6,407 3,906 4,956 5,466 31,637 18,8615 to 19 5,993 5,345 5,492 2,562 1,012 423 1,187 98620 to 49 514 899 1,084 832 267 138 261 24350 or 466 662 1,834 2,605 629 399 612 595moreMobile 47,830 37,188 47,568 17,341 2,796 938 2,807homeBoat, RV, 163 129 112 30 82 20 71Van, etc.Source: <strong>Ohio</strong> Department of Development, State of <strong>Ohio</strong> FY 2005-2009 Consolidated <strong>Plan</strong> Strategy.Estimated Impacts and Beneficiaries of Homeownership Education and Counseling(Figure II)Reduced loan delinquency• Borrowers avoid penalty fees, credit blemish, default costs and emotional stress• Lenders avoid lost revenue• Neighborhoods avoid vacant homes from foreclosureSource: Hirad and Zorn (2001); Hartarska, Gonzalez-Vega and Dobos (2002); Staten, Elliehausen and Lundquist (2002)Improved financial health and increased knowledge• Borrowers are more creditworthy and have less stressSource: Staten, Elliehausen and Lundquist (2002) Additional research neededIncreased neighborhood satisfaction• Borrowers are happier• Neighborhoods have invested residentsResearch needed57
- Page 3 and 4:
OHFA Annual PlanThe Ohio Housing Fi
- Page 5: Mission StatementsThe OHFA Annual P
- Page 8 and 9: The State’s Housing NeedsAffordab
- Page 10 and 11: Subject Matter Expert (SME) Workgro
- Page 12 and 13: 3. Financial LiteracyOHFA and other
- Page 14 and 15: Affordable Housing Preservation & D
- Page 16 and 17: federal subsidies. To achieve this
- Page 18 and 19: Accessible HousingBackground DataOh
- Page 20 and 21: 3) Create dedicated funding streams
- Page 22 and 23: • Recommend that Ohio support the
- Page 24 and 25: Rural and Appalachian RegionsBackgr
- Page 26 and 27: 6. Annual Set-Asides and Incentives
- Page 28 and 29: • Several cities in Ohio current
- Page 30 and 31: OHFA should provide funding, traini
- Page 32 and 33: Permanent Supportive Housing Produc
- Page 34 and 35: 3. The State should assist local Co
- Page 45 and 46: PrioritizationThe challenge of prio
- Page 47 and 48: Agency RecommendationsThe Annual Pl
- Page 49 and 50: APPENDIXWorkgroup 1: Affordable Hom
- Page 51 and 52: Executive SummaryHousing Need Descr
- Page 53 and 54: efficiency and resource conservatio
- Page 55: 554. Home Buyer Education in OHFA F
- Page 59 and 60: Ohio County Foreclosure Filings (19
- Page 61 and 62: Operating Costs - Met and Unmet Nee
- Page 63 and 64: Workgroup #2:Affordable Housing Pre
- Page 65 and 66: Secondary Recommendations• Explor
- Page 67 and 68: Executive SummaryOhio’s supply of
- Page 69 and 70: Met Housing Needs (“Resource Inve
- Page 71 and 72: Ohio Deptof MentalRetardation andDe
- Page 73 and 74: Unmet Housing NeedsData OverviewThe
- Page 75 and 76: ody, and will be built within the C
- Page 77 and 78: • OHFA will continue to maintain
- Page 79 and 80: Best Practices, Policies and Progra
- Page 81 and 82: addition, 60,111 one-person househo
- Page 83 and 84: Across Ohio, people with very low i
- Page 85 and 86: • Responsible for Rent - The pers
- Page 87 and 88: Seattle, St. Louis, and Washington,
- Page 89 and 90: Primary Recommendations• Create a
- Page 91 and 92: Unmet Housing Needs:• Due to the
- Page 93 and 94: • The cost of construction often
- Page 95 and 96: Recommendations for Annual Plan Adv
- Page 97 and 98: capacity to quantify vacant propert
- Page 99 and 100: distributed on or about January 15,
- Page 101 and 102: Action is needed at the State level
- Page 103 and 104: a “user-friendly” data system,
- Page 105 and 106: 5) Incentivize the formation of bro
- Page 107 and 108:
Workgroup #8:Permanent Supportive H
- Page 109 and 110:
3. Assist local Continuums of Care
- Page 111 and 112:
Program and Resource InventoryNonpr
- Page 113 and 114:
Table 2PopulationsPersons whoexperi
- Page 115 and 116:
Examples: A national model for succ
- Page 117 and 118:
oles, so they create a contract bet
- Page 119 and 120:
Workgroup #8:Appendix ANameProgramD
- Page 121 and 122:
or remedyingneglect, abuse,or the e
- Page 123 and 124:
ased healthcare, and earlyintervent
- Page 125 and 126:
“Bob” of Stark County, OhioPubl