Business Studies Collins Revision Guide. - StudyGuide.PK
Business Studies Collins Revision Guide. - StudyGuide.PK
Business Studies Collins Revision Guide. - StudyGuide.PK

You also want an ePaper? Increase the reach of your titles
YUMPU automatically turns print PDFs into web optimized ePapers that Google loves.
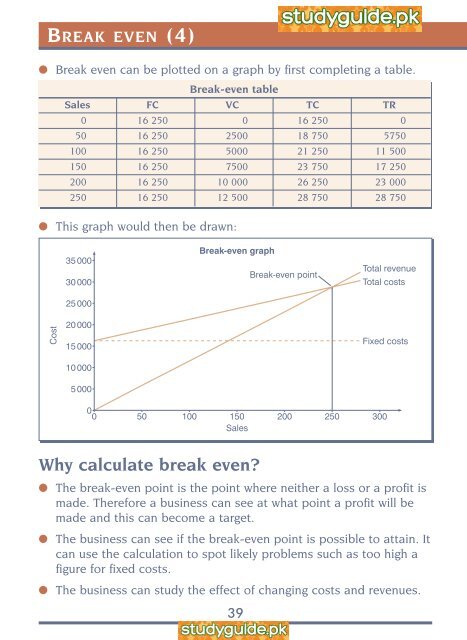
BREAK EVEN (4)●●Break even can be plotted on a graph by first completing a table.Break-even tableSales FC VC TC TR0 16 250 0 16 250 050 16 250 2500 18 750 5750100 16 250 5000 21 250 11 500150 16 250 7500 23 750 17 250200 16 250 10 000 26 250 23 000250 16 250 12 500 28 750 28 750This graph would then be drawn:35 00030 00025 000Break-even graphBreak-even pointTotal revenueTotal costsCost20 00015 00010 0005 000Fixed costs0 0 50 100 150 200 250 300SalesWhy calculate break even?●●●The break-even point is the point where neither a loss or a profit ismade. Therefore a business can see at what point a profit will bemade and this can become a target.The business can see if the break-even point is possible to attain. Itcan use the calculation to spot likely problems such as too high afigure for fixed costs.The business can study the effect of changing costs and revenues.39