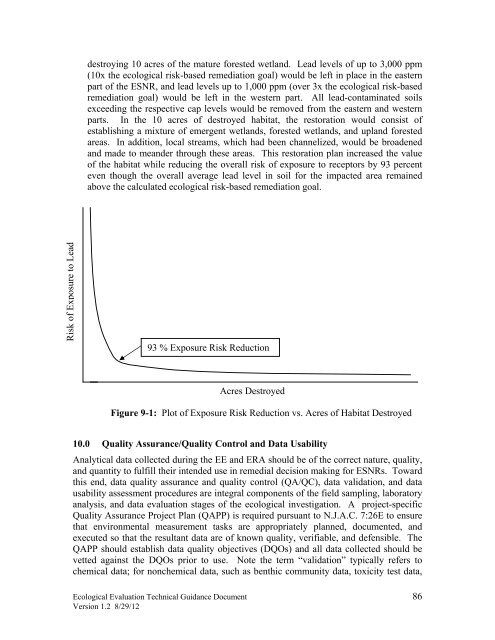
decision making and implementation. RMDs should reduce ecological risks to levelsthat will result in the recovery and maintenance <strong>of</strong> healthy local populations andcommunities. In some instances, the proposed remedy may cause more ecologicaldamage then leaving the contaminant in place, particularly where rare or sensitivehabitats exist because <strong>of</strong> widespread physical destruction or alteration <strong>of</strong> the habitatthrough excavation or in situ treatment; however, leaving persistent and/orbioaccumulative contaminants in place may cause an ongoing source <strong>of</strong> contaminantexposure (USEPA, 1999a). In addition, the proposed remedial action may not beachievable because <strong>of</strong> technical impracticability.RMDs consider the present and predicted value <strong>of</strong> the affected ESNRs, and thebeneficial and detrimental effects on the ESNRs’ value with implementation <strong>of</strong> thepotential remedial activities. The key components to consider during the RMD are(1) that impaired habitats can provide some valuable ecological benefit (e.g. foodsource, breeding, rearing, and shelter), (2) the ecosystem extends beyond theperimeter <strong>of</strong> the impaired area, and (3) reduction in ecological benefits in one area <strong>of</strong>the ecosystem may be <strong>of</strong>fset by a corresponding increase in ecological benefits inanother part <strong>of</strong> the ecosystem. Restoration activities should exceed the futuredecreased ecological benefits associated with the continued exposure to COPECs orany remedial activities. All RMDs must be approved by NJDEP (N.J.A.C. 7:26E-4.8(c)3). Examples <strong>of</strong> RMDs are noted in the following text.The following is presented solely to serve as an example <strong>of</strong> one project’s balancing <strong>of</strong>remedial actions and preservation <strong>of</strong> habitat. Other methods <strong>of</strong> balancing these goalsmay be used on a site-specific basis.A firing range is located within a 100-acre mature forested wetland, which iscontiguous with another 500 acres <strong>of</strong> forested wetland, emergent wetland and uplandhabitat. Lead levels exceeding 200,000 ppm have been recorded in surface soils.Contaminated soil depths range from six inches to 30 inches. Based on site-specificBAFs for the earthworm, an ecological risk-based remediation goal <strong>of</strong> 300 ppm hasbeen established for lead based on the woodcock as the higher trophic level receptor.To achieve an average <strong>of</strong> 300 ppm <strong>of</strong> lead in the soil <strong>of</strong> the impacted wetland area,over 90 acres <strong>of</strong> the wetland would have to be destroyed and excavated, and clean fillwould have to be imported to re-establish the grade and replant. Historically, thesuccess <strong>of</strong> re-establishing mature forested wetlands in <strong>New</strong> <strong>Jersey</strong> is limited.According to a 2002 report, “on average, 92% <strong>of</strong> proposed emergent wetland acreagewas achieved, while 1% percent <strong>of</strong> proposed forested wetland acreage was achieved(NJDEP, 2002).”Therefore, an RMD was made to reduce the number <strong>of</strong> acres <strong>of</strong> habitat destroyedwhile still reducing risk and enhancing the habitat to add value to the ecologicalbenefits. A graph was established for the two areas <strong>of</strong> the ESNR with the highestlead levels in soil (see Figure 9-1). The volumetric reduction in total lead(concentration and volume <strong>of</strong> surficial lead removed) was plotted on the Y-axis andthe number <strong>of</strong> acres destroyed was plotted on the X-axis (Figure 9-1). By examiningthese graphs, it was determined that by removing soil in the most highly contaminatedareas and replacing these soils with noncontaminated fill, a 93 percent reduction inexposure risk (volumetric reduction in total lead) could be attained with only<strong>Ecological</strong> <strong>Evaluation</strong> <strong>Technical</strong> <strong>Guidance</strong> Document 85Version 1.2 8/29/12
destroying 10 acres <strong>of</strong> the mature forested wetland. Lead levels <strong>of</strong> up to 3,000 ppm(10x the ecological risk-based remediation goal) would be left in place in the easternpart <strong>of</strong> the ESNR, and lead levels up to 1,000 ppm (over 3x the ecological risk-basedremediation goal) would be left in the western part. All lead-contaminated soilsexceeding the respective cap levels would be removed from the eastern and westernparts. In the 10 acres <strong>of</strong> destroyed habitat, the restoration would consist <strong>of</strong>establishing a mixture <strong>of</strong> emergent wetlands, forested wetlands, and upland forestedareas. In addition, local streams, which had been channelized, would be broadenedand made to meander through these areas. This restoration plan increased the value<strong>of</strong> the habitat while reducing the overall risk <strong>of</strong> exposure to receptors by 93 percenteven though the overall average lead level in soil for the impacted area remainedabove the calculated ecological risk-based remediation goal.Risk <strong>of</strong> Exposure to Lead93 % Exposure Risk ReductionAcres DestroyedFigure 9-1: Plot <strong>of</strong> Exposure Risk Reduction vs. Acres <strong>of</strong> Habitat Destroyed10.0 Quality Assurance/Quality Control and Data UsabilityAnalytical data collected during the EE and ERA should be <strong>of</strong> the correct nature, quality,and quantity to fulfill their intended use in remedial decision making for ESNRs. Towardthis end, data quality assurance and quality control (QA/QC), data validation, and datausability assessment procedures are integral components <strong>of</strong> the field sampling, laboratoryanalysis, and data evaluation stages <strong>of</strong> the ecological investigation. A project-specificQuality Assurance Project Plan (QAPP) is required pursuant to N.J.A.C. 7:26E to ensurethat environmental measurement tasks are appropriately planned, documented, andexecuted so that the resultant data are <strong>of</strong> known quality, verifiable, and defensible. TheQAPP should establish data quality objectives (DQOs) and all data collected should bevetted against the DQOs prior to use. Note the term “validation” typically refers tochemical data; for nonchemical data, such as benthic community data, toxicity test data,<strong>Ecological</strong> <strong>Evaluation</strong> <strong>Technical</strong> <strong>Guidance</strong> Document 86Version 1.2 8/29/12
- Page 1 and 2:
Ecological EvaluationTechnical Guid
- Page 3 and 4:
6.2.1.3 Biological Sampling of Fish
- Page 5 and 6:
Acronyms and AbbreviationsADDAETAFA
- Page 7 and 8:
Executive SummaryThis document prov
- Page 9 and 10:
environmentally sensitive areas pur
- Page 11 and 12:
Figure 3-1: Flow diagram to describ
- Page 13 and 14:
assessment may also include evaluat
- Page 15 and 16:
“Hazard quotient” or “HQ” m
- Page 17 and 18:
“Site investigation” means the
- Page 19 and 20:
parameters as specified in ERAGS (i
- Page 21 and 22:
document otherwise). The investigat
- Page 23 and 24:
5.3.2.1 Potential Contaminant Migra
- Page 25 and 26:
71 0Sampling pointsSampling transec
- Page 27 and 28:
5.3.4 Background ConsiderationsIt i
- Page 29 and 30:
III. GroundwaterAnalytical data fro
- Page 31 and 32:
5.5 Ecological Evaluation ReportThe
- Page 33 and 34:
Step 1 - Preliminary Screening Leve
- Page 35 and 36: specific measurements of receptor h
- Page 37 and 38: Figure 6-2: Ecological Conceptual S
- Page 39 and 40: ingested, air inhaled, or material
- Page 41 and 42: Fugacity, which is described as the
- Page 43 and 44: environment. As noted in ERAGS, the
- Page 45 and 46: Sample SelectionAfter completing th
- Page 47 and 48: While there are many laboratories t
- Page 49 and 50: ioavailability, and by doing so, of
- Page 51 and 52: For the purposes of surface water,
- Page 53 and 54: higher trophic level receptors. Lip
- Page 55 and 56: Details regarding surface water tox
- Page 57 and 58: e present at intervals greater than
- Page 59 and 60: elatively sedentary organisms that
- Page 61 and 62: COPECs. The following references ar
- Page 63 and 64: tests (USEPA, 2002e). After collect
- Page 65 and 66: multiple reference area soils repre
- Page 67 and 68: In ERAs, tissue residue analyses ar
- Page 69 and 70: Objectives of the ERA: including a
- Page 71 and 72: evaluation might necessitate the co
- Page 73 and 74: N.J.A.C. 7:26E-4.8(c)1. The ERA may
- Page 75 and 76: sediment (i.e., that fraction that
- Page 77 and 78: Twelve dioxin-like PCB congeners ha
- Page 79 and 80: indicates burial of potential dioxi
- Page 81 and 82: of evidence for evaluating risk unt
- Page 83 and 84: 7.2.1 Apparent Effects Threshold Ap
- Page 85: when site conditions are most simil
- Page 89 and 90: ASTM (American Society for Testing
- Page 91 and 92: Establishing Sediment Quality Crite
- Page 93 and 94: N.J.A.C. (New Jersey Administrative
- Page 95 and 96: USEPA. 1989c. Risk Assessment Guida
- Page 97 and 98: http://www.epa.gov/owow/oceans/regu
- Page 99 and 100: USEPA 2006a. Data Quality Assessmen
- Page 101 and 102: Appendix A - Habitat Survey FormsEc
- Page 103 and 104: Ecological Evaluation Technical Gui
- Page 105 and 106: Appendix B - Sampling Procedures fo
- Page 107 and 108: Appendix C - Surface Water Toxicity
- Page 109 and 110: Short-term chronic studies, endpoin
- Page 111 and 112: Appendix D - Sediment Toxicity Test
- Page 113 and 114: Toxicity Test DesignSediment toxici
- Page 115 and 116: Appendix E - Sediment Pore Water an
- Page 117 and 118: The seven-day daphnid survival and
- Page 119 and 120: esults are then evaluated using USE
- Page 121 and 122: Surber or Square-foot BottomThis sa
- Page 123 and 124: Appendix H - Soil Toxicity TestingS
- Page 125 and 126: another sample may still have a sub
- Page 127 and 128: conservative approach from an ecolo
- Page 129: Data PresentationTabular presentati