Field Value Title Barnsley In Depth Children & Young People's ...
Field Value Title Barnsley In Depth Children & Young People's ...
Field Value Title Barnsley In Depth Children & Young People's ...

You also want an ePaper? Increase the reach of your titles
YUMPU automatically turns print PDFs into web optimized ePapers that Google loves.
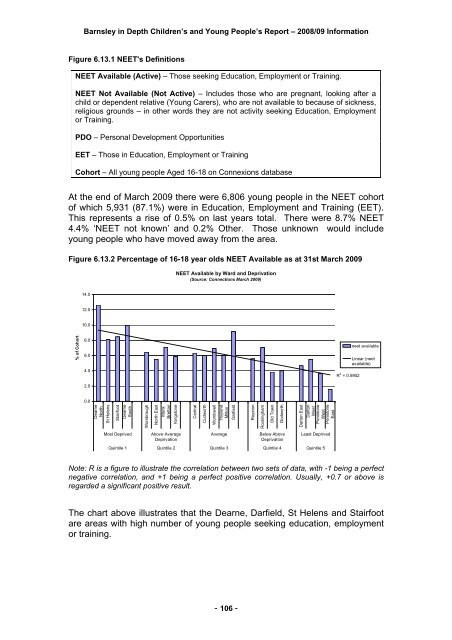
<strong>Barnsley</strong> in <strong>Depth</strong> <strong>Children</strong>’s and <strong>Young</strong> People’s Report – 2008/09 <strong>In</strong>formationFigure 6.13.1 NEET's DefinitionsNEET Available (Active) – Those seeking Education, Employment or Training.NEET Not Available (Not Active) – <strong>In</strong>cludes those who are pregnant, looking after achild or dependent relative (<strong>Young</strong> Carers), who are not available to because of sickness,religious grounds – in other words they are not activity seeking Education, Employmentor Training.PDO – Personal Development OpportunitiesEET – Those in Education, Employment or TrainingCohort – All young people Aged 16-18 on Connexions databaseAt the end of March 2009 there were 6,806 young people in the NEET cohortof which 5,931 (87.1%) were in Education, Employment and Training (EET).This represents a rise of 0.5% on last years total. There were 8.7% NEET4.4% ‘NEET not known’ and 0.2% Other. Those unknown would includeyoung people who have moved away from the area.Figure 6.13.2 Percentage of 16-18 year olds NEET Available as at 31st March 2009NEET Available by Ward and Deprivation(Source: Connections March 2009)14.012.010.0% of Cohort8.06.04.02.0R 2 = 0.5902neet availableLinear (neetavailable)0.0DearneNorthSt HelensStairfootDearneSouthWorsbroughNorth EastMonkBrettonKingstoneCentralCudworthWombwellHoylandMiltonDarfieldRoystonRockinghamOld TownDodworthDarton EastDartonWestPenistoneWestPenistoneEastMost DeprivedAbove AverageDeprivationAverageBelow AboveDeprivationLeast DeprivedQuintile 1 Quintile 2 Quintile 3 Quintile 4 Quintile 5Note: R is a figure to illustrate the correlation between two sets of data, with -1 being a perfectnegative correlation, and +1 being a perfect positive correlation. Usually, +0.7 or above isregarded a significant positive result.The chart above illustrates that the Dearne, Darfield, St Helens and Stairfootare areas with high number of young people seeking education, employmentor training.- 106 -