Field Value Title Barnsley In Depth Children & Young People's ...
Field Value Title Barnsley In Depth Children & Young People's ...
Field Value Title Barnsley In Depth Children & Young People's ...

You also want an ePaper? Increase the reach of your titles
YUMPU automatically turns print PDFs into web optimized ePapers that Google loves.
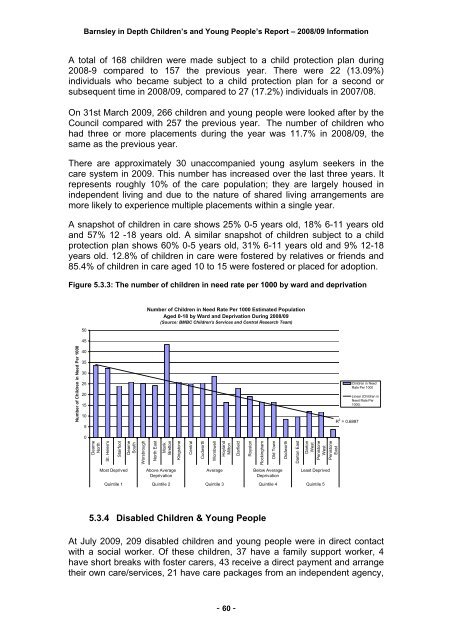
<strong>Barnsley</strong> in <strong>Depth</strong> <strong>Children</strong>’s and <strong>Young</strong> People’s Report – 2008/09 <strong>In</strong>formationA total of 168 children were made subject to a child protection plan during2008-9 compared to 157 the previous year. There were 22 (13.09%)individuals who became subject to a child protection plan for a second orsubsequent time in 2008/09, compared to 27 (17.2%) individuals in 2007/08.On 31st March 2009, 266 children and young people were looked after by theCouncil compared with 257 the previous year. The number of children whohad three or more placements during the year was 11.7% in 2008/09, thesame as the previous year.There are approximately 30 unaccompanied young asylum seekers in thecare system in 2009. This number has increased over the last three years. Itrepresents roughly 10% of the care population; they are largely housed inindependent living and due to the nature of shared living arrangements aremore likely to experience multiple placements within a single year.A snapshot of children in care shows 25% 0-5 years old, 18% 6-11 years oldand 57% 12 -18 years old. A similar snapshot of children subject to a childprotection plan shows 60% 0-5 years old, 31% 6-11 years old and 9% 12-18years old. 12.8% of children in care were fostered by relatives or friends and85.4% of children in care aged 10 to 15 were fostered or placed for adoption.Figure 5.3.3: The number of children in need rate per 1000 by ward and deprivation50Number of <strong>Children</strong> in Need Rate Per 1000 Estimated PopulationAged 0-18 by Ward and Deprivation During 2008/09(Source: BMBC <strong>Children</strong>'s Services and Central Research Team)Number of <strong>Children</strong> in Need Per 1000454035302520151050R 2 = 0.6897<strong>Children</strong> in NeedRate Per 1000Linear (<strong>Children</strong> inNeed Rate Per1000)DearneNorthSt. Helen'sStairfootDearneSouthWorsbroughNorth EastMonkBrettonKingstoneCentralCudworthWombwellHoylandMiltonDarfieldRoystonRockinghamOld TownDodworthDarton EastDartonWestPenistoneWestPenistoneEastMost DeprivedAbove AverageDeprivationAverageBelow AverageDeprivationLeast DeprivedQuintile 1 Quintile 2 Quintile 3 Quintile 4 Quintile 55.3.4 Disabled <strong>Children</strong> & <strong>Young</strong> PeopleAt July 2009, 209 disabled children and young people were in direct contactwith a social worker. Of these children, 37 have a family support worker, 4have short breaks with foster carers, 43 receive a direct payment and arrangetheir own care/services, 21 have care packages from an independent agency,- 60 -