Field Value Title Barnsley In Depth Children & Young People's ...
Field Value Title Barnsley In Depth Children & Young People's ...
Field Value Title Barnsley In Depth Children & Young People's ...

Create successful ePaper yourself
Turn your PDF publications into a flip-book with our unique Google optimized e-Paper software.
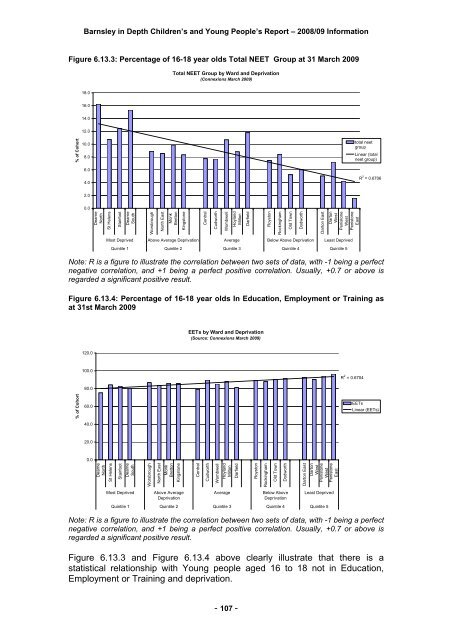
<strong>Barnsley</strong> in <strong>Depth</strong> <strong>Children</strong>’s and <strong>Young</strong> People’s Report – 2008/09 <strong>In</strong>formationFigure 6.13.3: Percentage of 16-18 year olds Total NEET Group at 31 March 2009Total NEET Group by Ward and Deprivation(Connexions March 2009)18.016.014.012.0% of Cohort10.08.06.04.0total neetgroupLinear (totalneet group)R 2 = 0.67062.00.0DearneNorthSt HelensStairfootDearneSouthWorsbroughNorth EastMonkBrettonKingstoneCentralCudworthWombwellHoylandMiltonDarfieldRoystonRockinghamOld TownDodworthDarton EastDartonWestPenistoneWestPenistoneEastMost Deprived Above Average Deprivation Average Below Above Deprivation Least DeprivedQuintile 1 Quintile 2 Quintile 3 Quintile 4 Quintile 5Note: R is a figure to illustrate the correlation between two sets of data, with -1 being a perfectnegative correlation, and +1 being a perfect positive correlation. Usually, +0.7 or above isregarded a significant positive result.Figure 6.13.4: Percentage of 16-18 year olds <strong>In</strong> Education, Employment or Training asat 31st March 2009EETs by Ward and Deprivation(Source: Connexions March 2009)120.0100.0R 2 = 0.6704% of Cohort80.060.040.0EETsLinear (EETs)20.00.0DearneNorthSt HelensStairfootDearneSouthWorsbroughNorth EastMonkBrettonKingstoneCentralCudworthWombwellHoylandMiltonDarfieldRoystonRockinghamOld TownDodworthDarton EastDartonWestPenistoneWestPenistoneEastMost DeprivedAbove AverageDeprivationAverageBelow AboveDeprivationLeast DeprivedQuintile 1 Quintile 2 Quintile 3 Quintile 4 Quintile 5Note: R is a figure to illustrate the correlation between two sets of data, with -1 being a perfectnegative correlation, and +1 being a perfect positive correlation. Usually, +0.7 or above isregarded a significant positive result.Figure 6.13.3 and Figure 6.13.4 above clearly illustrate that there is astatistical relationship with <strong>Young</strong> people aged 16 to 18 not in Education,Employment or Training and deprivation.- 107 -