Field Value Title Barnsley In Depth Children & Young People's ...
Field Value Title Barnsley In Depth Children & Young People's ...
Field Value Title Barnsley In Depth Children & Young People's ...

You also want an ePaper? Increase the reach of your titles
YUMPU automatically turns print PDFs into web optimized ePapers that Google loves.
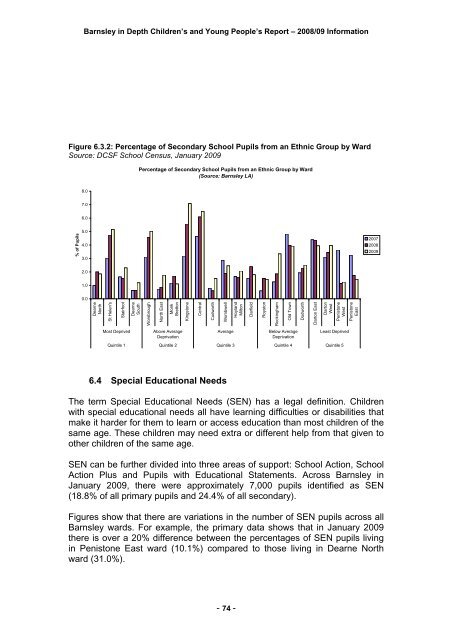
<strong>Barnsley</strong> in <strong>Depth</strong> <strong>Children</strong>’s and <strong>Young</strong> People’s Report – 2008/09 <strong>In</strong>formationFigure 6.3.2: Percentage of Secondary School Pupils from an Ethnic Group by WardSource: DCSF School Census, January 2009Percentage of Secondary School Pupils from an Ethnic Group by Ward(Source: <strong>Barnsley</strong> LA)8.07.06.0% of Pupils5.04.03.02007200820092.01.00.0DearneNorthSt Helen'sStairfootDearneSouthWorsbroughNorth EastMonkBrettonKingstoneCentralCudworthWombwellHoylandMiltonDarfieldRoystonRockinghamOld TownDodworthDarton EastDartonWestPenistoneWestPenistoneEastMost DeprivedAbove AverageDeprivationAverageBelow AverageDeprivationLeast DeprivedQuintile 1 Quintile 2 Quintile 3 Quintile 4 Quintile 56.4 Special Educational NeedsThe term Special Educational Needs (SEN) has a legal definition. <strong>Children</strong>with special educational needs all have learning difficulties or disabilities thatmake it harder for them to learn or access education than most children of thesame age. These children may need extra or different help from that given toother children of the same age.SEN can be further divided into three areas of support: School Action, SchoolAction Plus and Pupils with Educational Statements. Across <strong>Barnsley</strong> inJanuary 2009, there were approximately 7,000 pupils identified as SEN(18.8% of all primary pupils and 24.4% of all secondary).Figures show that there are variations in the number of SEN pupils across all<strong>Barnsley</strong> wards. For example, the primary data shows that in January 2009there is over a 20% difference between the percentages of SEN pupils livingin Penistone East ward (10.1%) compared to those living in Dearne Northward (31.0%).- 74 -