Field Value Title Barnsley In Depth Children & Young People's ...
Field Value Title Barnsley In Depth Children & Young People's ...
Field Value Title Barnsley In Depth Children & Young People's ...

You also want an ePaper? Increase the reach of your titles
YUMPU automatically turns print PDFs into web optimized ePapers that Google loves.
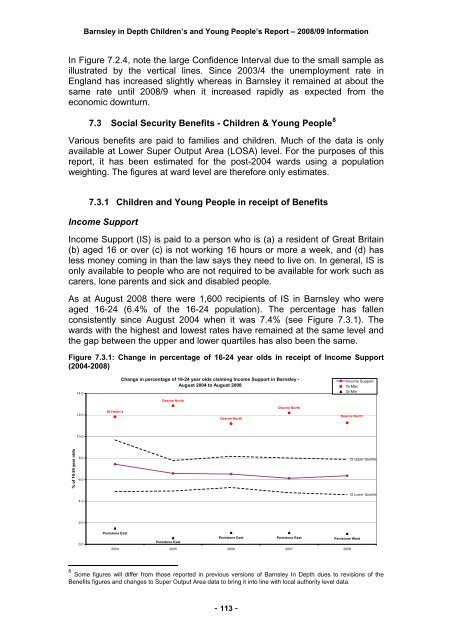
<strong>Barnsley</strong> in <strong>Depth</strong> <strong>Children</strong>’s and <strong>Young</strong> People’s Report – 2008/09 <strong>In</strong>formation<strong>In</strong> Figure 7.2.4, note the large Confidence <strong>In</strong>terval due to the small sample asillustrated by the vertical lines. Since 2003/4 the unemployment rate inEngland has increased slightly whereas in <strong>Barnsley</strong> it remained at about thesame rate until 2008/9 when it increased rapidly as expected from theeconomic downturn.7.3 Social Security Benefits - <strong>Children</strong> & <strong>Young</strong> People 8Various benefits are paid to families and children. Much of the data is onlyavailable at Lower Super Output Area (LOSA) level. For the purposes of thisreport, it has been estimated for the post-2004 wards using a populationweighting. The figures at ward level are therefore only estimates.7.3.1 <strong>Children</strong> and <strong>Young</strong> People in receipt of Benefits<strong>In</strong>come Support<strong>In</strong>come Support (IS) is paid to a person who is (a) a resident of Great Britain(b) aged 16 or over (c) is not working 16 hours or more a week, and (d) hasless money coming in than the law says they need to live on. <strong>In</strong> general, IS isonly available to people who are not required to be available for work such ascarers, lone parents and sick and disabled people.As at August 2008 there were 1,600 recipients of IS in <strong>Barnsley</strong> who wereaged 16-24 (6.4% of the 16-24 population). The percentage has fallenconsistently since August 2004 when it was 7.4% (see Figure 7.3.1). Thewards with the highest and lowest rates have remained at the same level andthe gap between the upper and lower quartiles has also been the same.Figure 7.3.1: Change in percentage of 16-24 year olds in receipt of <strong>In</strong>come Support(2004-2008)14.0Change in percentage of 16-24 year olds claiming <strong>In</strong>come Support in <strong>Barnsley</strong> -August 2004 to August 2008Dearne North<strong>In</strong>come SupportIS MaxIS Min12.0St Helen'sDearne NorthDearne NorthDearne North10.0% of 16-24 year olds8.06.04.0IS Upper QuartileIS Lower Quartile2.00.0Penistone EastPenistone EastPenistone EastPenistone WestPenistone East2004 2005 2006 2007 20088 Some figures will differ from those reported in previous versions of <strong>Barnsley</strong> <strong>In</strong> <strong>Depth</strong> dues to revisions of theBenefits figures and changes to Super Output Area data to bring it into line with local authority level data.- 113 -