Field Value Title Barnsley In Depth Children & Young People's ...
Field Value Title Barnsley In Depth Children & Young People's ...
Field Value Title Barnsley In Depth Children & Young People's ...

Create successful ePaper yourself
Turn your PDF publications into a flip-book with our unique Google optimized e-Paper software.
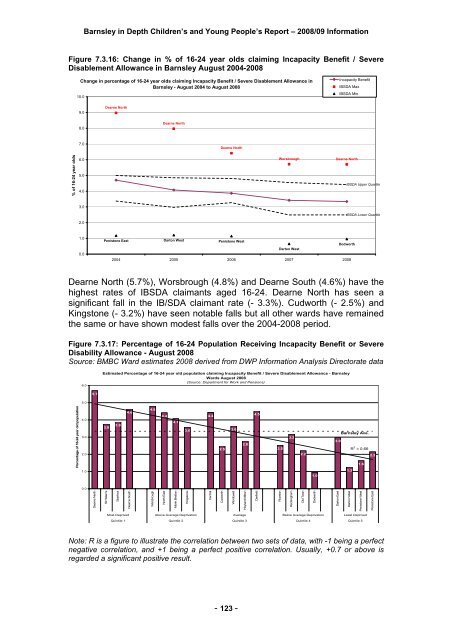
<strong>Barnsley</strong> in <strong>Depth</strong> <strong>Children</strong>’s and <strong>Young</strong> People’s Report – 2008/09 <strong>In</strong>formationFigure 7.3.16: Change in % of 16-24 year olds claiming <strong>In</strong>capacity Benefit / SevereDisablement Allowance in <strong>Barnsley</strong> August 2004-2008Change in percentage of 16-24 year olds claiming <strong>In</strong>capacity Benefit / Severe Disablement Allowance in<strong>Barnsley</strong> - August 2004 to August 200810.0<strong>In</strong>capacity BenefitIBSDA MaxIBSDA Min9.0Dearne North8.0Dearne North7.0Dearne North% of 16-24 year olds6.05.04.0WorsbroughDearne NorthIBSDA Upper Quartile3.0IBSDA Lower Quartile2.01.00.0Penistone EastDarton WestPenistone WestDodworthDarton West2004 2005 2006 2007 2008Dearne North (5.7%), Worsbrough (4.8%) and Dearne South (4.6%) have thehighest rates of IBSDA claimants aged 16-24. Dearne North has seen asignificant fall in the IB/SDA claimant rate (- 3.3%). Cudworth (- 2.5%) andKingstone (- 3.2%) have seen notable falls but all other wards have remainedthe same or have shown modest falls over the 2004-2008 period.Figure 7.3.17: Percentage of 16-24 Population Receiving <strong>In</strong>capacity Benefit or SevereDisability Allowance - August 2008Source: BMBC Ward estimates 2008 derived from DWP <strong>In</strong>formation Analysis Directorate data6.0Estimated Percentage of 16-24 year old population claiming <strong>In</strong>capacity Benefit / Severe Disablement Allowance - <strong>Barnsley</strong>Wards August 2008(Source: Department for Work and Pensions)5.75.0Percentage of 16-24 year old population4.03.02.01.03.83.94.64.84.44.13.64.42.53.62.84.52.53.22.21.0<strong>Barnsley</strong> Ave.3.0R 2 = 0.662.21.61.30.0Dearne NorthSt Helen'sStairfootDearne SouthWorsbroughNorth EastMonk BrettonKingstoneCentralCudworthWombwellHoyland MiltonDarfieldRoystonRockinghamOld TownDodworthDarton EastDarton WestPenistone WestPenistone EastMost Deprived Above Average Deprivation Average Below Average Deprivation Least DeprivedQuintile 1 Quintile 2 Quintile 3 Quintile 4 Quintile 5Note: R is a figure to illustrate the correlation between two sets of data, with -1 being a perfectnegative correlation, and +1 being a perfect positive correlation. Usually, +0.7 or above isregarded a significant positive result.- 123 -