Field Value Title Barnsley In Depth Children & Young People's ...
Field Value Title Barnsley In Depth Children & Young People's ...
Field Value Title Barnsley In Depth Children & Young People's ...

Create successful ePaper yourself
Turn your PDF publications into a flip-book with our unique Google optimized e-Paper software.
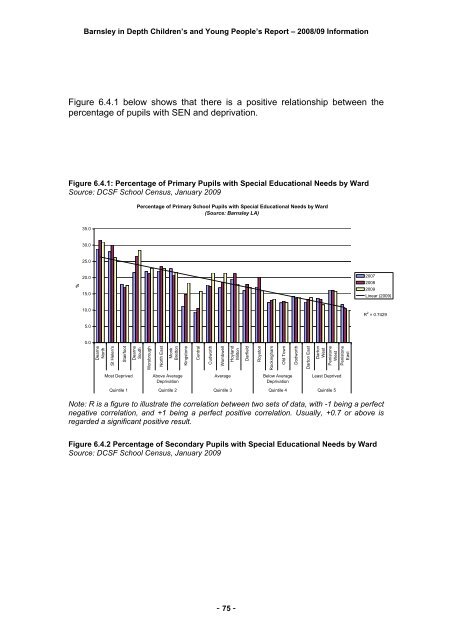
<strong>Barnsley</strong> in <strong>Depth</strong> <strong>Children</strong>’s and <strong>Young</strong> People’s Report – 2008/09 <strong>In</strong>formationFigure 6.4.1 below shows that there is a positive relationship between thepercentage of pupils with SEN and deprivation.Figure 6.4.1: Percentage of Primary Pupils with Special Educational Needs by WardSource: DCSF School Census, January 2009Percentage of Primary School Pupils with Special Educational Needs by Ward(Source: <strong>Barnsley</strong> LA)35.030.025.0%20.015.0200720082009Linear (2009)10.0R 2 = 0.74295.00.0DearneNorthSt Helen'sStairfootDearneSouthWorsbroughNorth EastMonkBrettonKingstoneCentralCudworthWombwellHoylandMiltonDarfieldRoystonRockinghamOld TownDodworthDarton EastDartonWestPenistoneWestPenistoneEastMost DeprivedAbove AverageDeprivationAverageBelow AverageDeprivationLeast DeprivedQuintile 1 Quintile 2 Quintile 3 Quintile 4 Quintile 5Note: R is a figure to illustrate the correlation between two sets of data, with -1 being a perfectnegative correlation, and +1 being a perfect positive correlation. Usually, +0.7 or above isregarded a significant positive result.Figure 6.4.2 Percentage of Secondary Pupils with Special Educational Needs by WardSource: DCSF School Census, January 2009- 75 -