Field Value Title Barnsley In Depth Children & Young People's ...
Field Value Title Barnsley In Depth Children & Young People's ...
Field Value Title Barnsley In Depth Children & Young People's ...

Create successful ePaper yourself
Turn your PDF publications into a flip-book with our unique Google optimized e-Paper software.
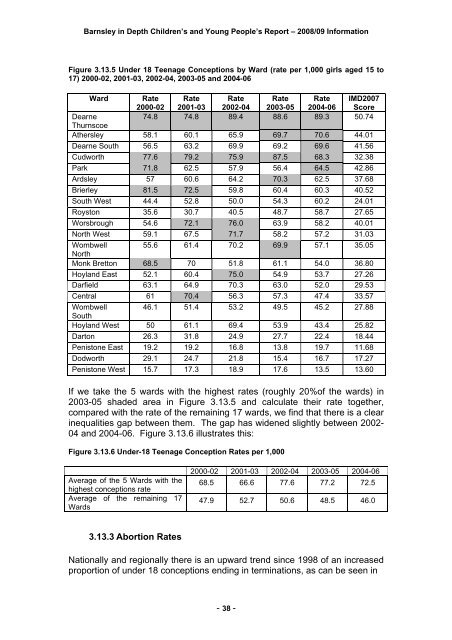
<strong>Barnsley</strong> in <strong>Depth</strong> <strong>Children</strong>’s and <strong>Young</strong> People’s Report – 2008/09 <strong>In</strong>formationFigure 3.13.5 Under 18 Teenage Conceptions by Ward (rate per 1,000 girls aged 15 to17) 2000-02, 2001-03, 2002-04, 2003-05 and 2004-06Ward Rate2000-02Rate2001-03Rate2002-04Rate2003-05Rate2004-06IMD2007ScoreDearne74.8 74.8 89.4 88.6 89.3 50.74ThurnscoeAthersley 58.1 60.1 65.9 69.7 70.6 44.01Dearne South 56.5 63.2 69.9 69.2 69.6 41.56Cudworth 77.6 79.2 75.9 87.5 68.3 32.38Park 71.8 62.5 57.9 56.4 64.5 42.86Ardsley 57 60.6 64.2 70.3 62.5 37.68Brierley 81.5 72.5 59.8 60.4 60.3 40.52South West 44.4 52.8 50.0 54.3 60.2 24.01Royston 35.6 30.7 40.5 48.7 58.7 27.65Worsbrough 54.6 72.1 76.0 63.9 58.2 40.01North West 59.1 67.5 71.7 58.2 57.2 31.03Wombwell 55.6 61.4 70.2 69.9 57.1 35.05NorthMonk Bretton 68.5 70 51.8 61.1 54.0 36.80Hoyland East 52.1 60.4 75.0 54.9 53.7 27.26Darfield 63.1 64.9 70.3 63.0 52.0 29.53Central 61 70.4 56.3 57.3 47.4 33.57Wombwell 46.1 51.4 53.2 49.5 45.2 27.88SouthHoyland West 50 61.1 69.4 53.9 43.4 25.82Darton 26.3 31.8 24.9 27.7 22.4 18.44Penistone East 19.2 19.2 16.8 13.8 19.7 11.68Dodworth 29.1 24.7 21.8 15.4 16.7 17.27Penistone West 15.7 17.3 18.9 17.6 13.5 13.60If we take the 5 wards with the highest rates (roughly 20%of the wards) in2003-05 shaded area in Figure 3.13.5 and calculate their rate together,compared with the rate of the remaining 17 wards, we find that there is a clearinequalities gap between them. The gap has widened slightly between 2002-04 and 2004-06. Figure 3.13.6 illustrates this:Figure 3.13.6 Under-18 Teenage Conception Rates per 1,000Average of the 5 Wards with thehighest conceptions rateAverage of the remaining 17Wards2000-02 2001-03 2002-04 2003-05 2004-0668.5 66.6 77.6 77.2 72.547.9 52.7 50.6 48.5 46.03.13.3 Abortion RatesNationally and regionally there is an upward trend since 1998 of an increasedproportion of under 18 conceptions ending in terminations, as can be seen in- 38 -