Field Value Title Barnsley In Depth Children & Young People's ...
Field Value Title Barnsley In Depth Children & Young People's ...
Field Value Title Barnsley In Depth Children & Young People's ...

You also want an ePaper? Increase the reach of your titles
YUMPU automatically turns print PDFs into web optimized ePapers that Google loves.
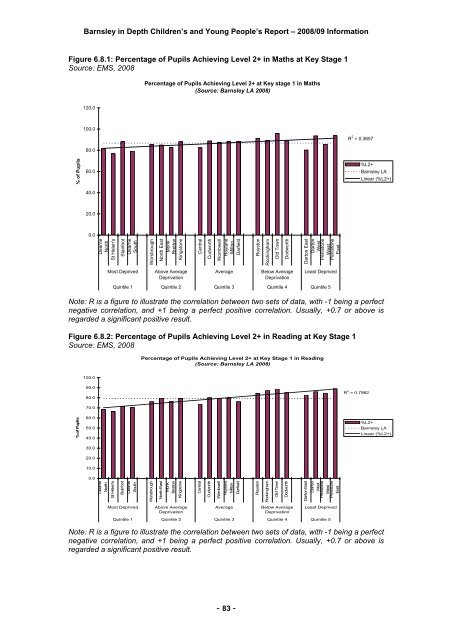
<strong>Barnsley</strong> in <strong>Depth</strong> <strong>Children</strong>’s and <strong>Young</strong> People’s Report – 2008/09 <strong>In</strong>formationFigure 6.8.1: Percentage of Pupils Achieving Level 2+ in Maths at Key Stage 1Source: EMS, 2008Percentage of Pupils Achieving Level 2+ at Key stage 1 in Maths(Source: <strong>Barnsley</strong> LA 2008)120.0100.080.0R 2 = 0.3657% of Pupils60.040.0%L2+<strong>Barnsley</strong> LALinear (%L2+)20.00.0DearneNorthSt Helen'sStairfootDearneSouthWorsbroughNorth EastMonkBrettonKingstoneCentralCudworthWombwellHoylandMiltonDarfieldRoystonRockinghamOld TownDodworthDarton EastDartonWestPenistoneWestPenistoneEastMost DeprivedAbove AverageDeprivationAverageBelow AverageDeprivationLeast DeprivedQuintile 1 Quintile 2 Quintile 3 Quintile 4 Quintile 5Note: R is a figure to illustrate the correlation between two sets of data, with -1 being a perfectnegative correlation, and +1 being a perfect positive correlation. Usually, +0.7 or above isregarded a significant positive result.Figure 6.8.2: Percentage of Pupils Achieving Level 2+ in Reading at Key Stage 1Source: EMS, 2008Percentage of Pupils Achieving Level 2+ at Key Stage 1 in Reading(Source: <strong>Barnsley</strong> LA 2008)100.090.080.0R 2 = 0.798270.0% of Pupils60.050.040.0%L2+<strong>Barnsley</strong> LALinear (%L2+)30.020.010.00.0DearneNorthSt Helen'sStairfootDearneSouthWorsbroughNorth EastMonkBrettonKingstoneCentralCudworthWombwellHoylandMiltonDarfieldRoystonRockinghamOld TownDodworthDarton EastDartonWestPenistoneWestPenistoneEastMost DeprivedAbove AverageDeprivationAverageBelow AverageDeprivationLeast DeprivedQuintile 1 Quintile 2 Quintile 3 Quintile 4 Quintile 5Note: R is a figure to illustrate the correlation between two sets of data, with -1 being a perfectnegative correlation, and +1 being a perfect positive correlation. Usually, +0.7 or above isregarded a significant positive result.- 83 -