Field Value Title Barnsley In Depth Children & Young People's ...
Field Value Title Barnsley In Depth Children & Young People's ...
Field Value Title Barnsley In Depth Children & Young People's ...

You also want an ePaper? Increase the reach of your titles
YUMPU automatically turns print PDFs into web optimized ePapers that Google loves.
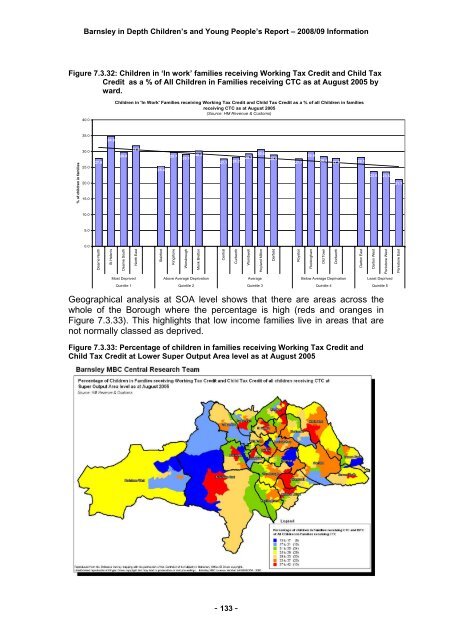
<strong>Barnsley</strong> in <strong>Depth</strong> <strong>Children</strong>’s and <strong>Young</strong> People’s Report – 2008/09 <strong>In</strong>formationFigure 7.3.32: <strong>Children</strong> in ‘<strong>In</strong> work’ families receiving Working Tax Credit and Child TaxCredit as a % of All <strong>Children</strong> in Families receiving CTC as at August 2005 byward.40.0<strong>Children</strong> in '<strong>In</strong> Work' Families receiving Working Tax Credit and Child Tax Credit as a % of all <strong>Children</strong> in familiesreceiving CTC as at August 2005(Source: HM Revenue & Customs)35.034.8% of children in families30.025.020.015.027.829.831.825.429.729.130.227.728.229.330.628.927.730.028.427.8 28.123.6 23.521.110.05.00.0Dearne NorthSt Helen'sDearne SouthNorth EastStairfootKingstoneWorsbroughMonk BrettonCentralCudworthWombwellHoyland MiltonDarfieldRoystonRockinghamOld TownDodworthDarton EastDarton WestPenistone WestPenistone EastMost Deprived Above Average Deprivation Average Below Average Deprivation Least DeprivedQuintile 1 Quintile 2 Quintile 3 Quintile 4 Quintile 5Geographical analysis at SOA level shows that there are areas across thewhole of the Borough where the percentage is high (reds and oranges inFigure 7.3.33). This highlights that low income families live in areas that arenot normally classed as deprived.Figure 7.3.33: Percentage of children in families receiving Working Tax Credit andChild Tax Credit at Lower Super Output Area level as at August 2005- 133 -