Field Value Title Barnsley In Depth Children & Young People's ...
Field Value Title Barnsley In Depth Children & Young People's ...
Field Value Title Barnsley In Depth Children & Young People's ...

You also want an ePaper? Increase the reach of your titles
YUMPU automatically turns print PDFs into web optimized ePapers that Google loves.
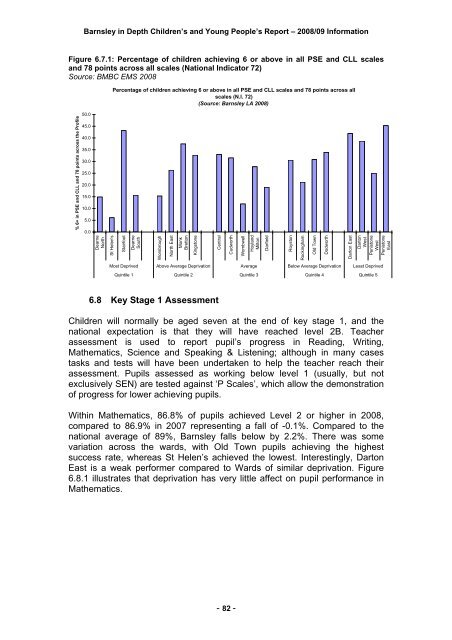
<strong>Barnsley</strong> in <strong>Depth</strong> <strong>Children</strong>’s and <strong>Young</strong> People’s Report – 2008/09 <strong>In</strong>formationFigure 6.7.1: Percentage of children achieving 6 or above in all PSE and CLL scalesand 78 points across all scales (National <strong>In</strong>dicator 72)Source: BMBC EMS 2008Percentage of children achieving 6 or above in all PSE and CLL scales and 78 points across allscales (N.I. 72)(Source: <strong>Barnsley</strong> LA 2008)% 6+ in PSE and CLL and 78 points across the Profile50.045.040.035.030.025.020.015.010.05.00.0DearneNorthSt Helen'sStairfootDearneSouthWorsbroughNorth EastMonkBrettonKingstoneCentralCudworthWombwellHoylandMiltonDarfieldRoystonRockinghamOld TownDodworthDarton EastDartonWestPenistoneWestPenistoneEastMost Deprived Above Average Deprivation Average Below Average Deprivation Least DeprivedQuintile 1 Quintile 2 Quintile 3 Quintile 4 Quintile 56.8 Key Stage 1 Assessment<strong>Children</strong> will normally be aged seven at the end of key stage 1, and thenational expectation is that they will have reached level 2B. Teacherassessment is used to report pupil’s progress in Reading, Writing,Mathematics, Science and Speaking & Listening; although in many casestasks and tests will have been undertaken to help the teacher reach theirassessment. Pupils assessed as working below level 1 (usually, but notexclusively SEN) are tested against ‘P Scales’, which allow the demonstrationof progress for lower achieving pupils.Within Mathematics, 86.8% of pupils achieved Level 2 or higher in 2008,compared to 86.9% in 2007 representing a fall of -0.1%. Compared to thenational average of 89%, <strong>Barnsley</strong> falls below by 2.2%. There was somevariation across the wards, with Old Town pupils achieving the highestsuccess rate, whereas St Helen’s achieved the lowest. <strong>In</strong>terestingly, DartonEast is a weak performer compared to Wards of similar deprivation. Figure6.8.1 illustrates that deprivation has very little affect on pupil performance inMathematics.- 82 -