Field Value Title Barnsley In Depth Children & Young People's ...
Field Value Title Barnsley In Depth Children & Young People's ...
Field Value Title Barnsley In Depth Children & Young People's ...

You also want an ePaper? Increase the reach of your titles
YUMPU automatically turns print PDFs into web optimized ePapers that Google loves.
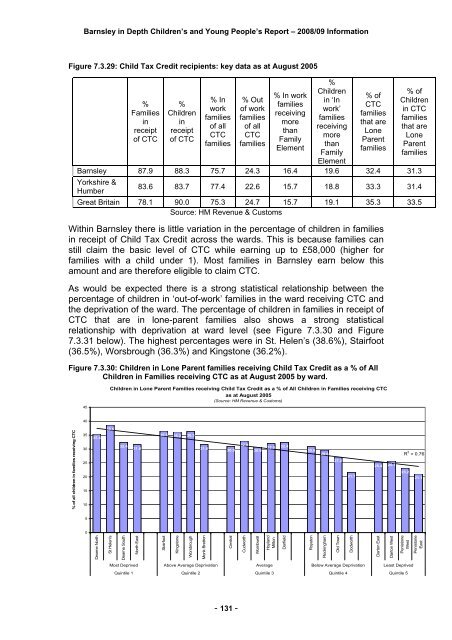
<strong>Barnsley</strong> in <strong>Depth</strong> <strong>Children</strong>’s and <strong>Young</strong> People’s Report – 2008/09 <strong>In</strong>formationFigure 7.3.29: Child Tax Credit recipients: key data as at August 2005%Familiesinreceiptof CTC%<strong>Children</strong>inreceiptof CTC% <strong>In</strong>workfamiliesof allCTCfamilies% Outof workfamiliesof allCTCfamilies% <strong>In</strong> workfamiliesreceivingmorethanFamilyElement%<strong>Children</strong>in ‘<strong>In</strong>work’familiesreceivingmorethanFamilyElement% ofCTCfamiliesthat areLoneParentfamilies% of<strong>Children</strong>in CTCfamiliesthat areLoneParentfamilies<strong>Barnsley</strong> 87.9 88.3 75.7 24.3 16.4 19.6 32.4 31.3Yorkshire &Humber83.6 83.7 77.4 22.6 15.7 18.8 33.3 31.4Great Britain 78.1 90.0 75.3 24.7 15.7 19.1 35.3 33.5Source: HM Revenue & CustomsWithin <strong>Barnsley</strong> there is little variation in the percentage of children in familiesin receipt of Child Tax Credit across the wards. This is because families canstill claim the basic level of CTC while earning up to £58,000 (higher forfamilies with a child under 1). Most families in <strong>Barnsley</strong> earn below thisamount and are therefore eligible to claim CTC.As would be expected there is a strong statistical relationship between thepercentage of children in ‘out-of-work’ families in the ward receiving CTC andthe deprivation of the ward. The percentage of children in families in receipt ofCTC that are in lone-parent families also shows a strong statisticalrelationship with deprivation at ward level (see Figure 7.3.30 and Figure7.3.31 below). The highest percentages were in St. Helen’s (38.6%), Stairfoot(36.5%), Worsbrough (36.3%) and Kingstone (36.2%).Figure 7.3.30: <strong>Children</strong> in Lone Parent families receiving Child Tax Credit as a % of All<strong>Children</strong> in Families receiving CTC as at August 2005 by ward.45<strong>Children</strong> in Lone Parent Families receiving Child Tax Credit as a % of All <strong>Children</strong> in Families receiving CTCas at August 2005(Source: HM Revenue & Customs)40% of all children in families receiving CTC35302520151035.438.632.431.636.5 36.2 36.331.630.932.930.932.0 32.430.929.627.221.725.4 25.7R 2 = 0.7623.221.150Dearne NorthSt Helen'sDearne SouthNorth EastStairfootKingstoneWorsbroughMonk BrettonCentralCudworthWombwellHoylandMiltonDarfieldRoystonRockinghamOld TownDodworthDarton EastDarton WestPenistoneWestPenistoneEastMost Deprived Above Average Deprivation Average Below Average Deprivation Least DeprivedQuintile 1 Quintile 2 Quintile 3 Quintile 4 Quintile 5- 131 -