

Evaluating non-randomised intervention studies - NIHR Health ...
Evaluating non-randomised intervention studies - NIHR Health ...
Evaluating non-randomised intervention studies - NIHR Health ...

You also want an ePaper? Increase the reach of your titles
YUMPU automatically turns print PDFs into web optimized ePapers that Google loves.
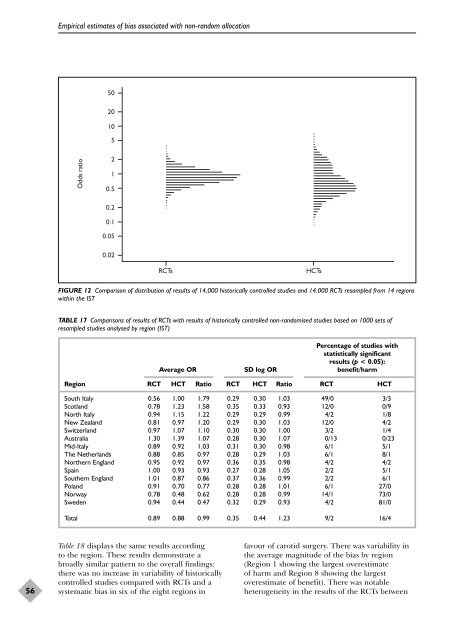
Empirical estimates of bias associated with <strong>non</strong>-random allocation5020105Odds ratio210.50.20.10.050.02RCTsHCTsFIGURE 12 Comparison of distribution of results of 14,000 historically controlled <strong>studies</strong> and 14,000 RCTs resampled from 14 regionswithin the ISTTABLE 17 Comparisons of results of RCTs with results of historically controlled <strong>non</strong>-<strong>randomised</strong> <strong>studies</strong> based on 1000 sets ofresampled <strong>studies</strong> analysed by region (IST)Percentage of <strong>studies</strong> withstatistically significantresults (p < 0.05):Average OR SD log OR benefit/harmRegion RCT HCT Ratio RCT HCT Ratio RCT HCTSouth Italy 0.56 1.00 1.79 0.29 0.30 1.03 49/0 3/3Scotland 0.78 1.23 1.58 0.35 0.33 0.93 12/0 0/9North Italy 0.94 1.15 1.22 0.29 0.29 0.99 4/2 1/8New Zealand 0.81 0.97 1.20 0.29 0.30 1.03 12/0 4/2Switzerland 0.97 1.07 1.10 0.30 0.30 1.00 3/2 1/4Australia 1.30 1.39 1.07 0.28 0.30 1.07 0/13 0/23Mid-Italy 0.89 0.92 1.03 0.31 0.30 0.98 6/1 5/1The Netherlands 0.88 0.85 0.97 0.28 0.29 1.03 6/1 8/1Northern England 0.95 0.92 0.97 0.36 0.35 0.98 4/2 4/2Spain 1.00 0.93 0.93 0.27 0.28 1.05 2/2 5/1Southern England 1.01 0.87 0.86 0.37 0.36 0.99 2/2 6/1Poland 0.91 0.70 0.77 0.28 0.28 1.01 6/1 27/0Norway 0.78 0.48 0.62 0.28 0.28 0.99 14/1 73/0Sweden 0.94 0.44 0.47 0.32 0.29 0.93 4/2 81/0Total 0.89 0.88 0.99 0.35 0.44 1.23 9/2 16/456Table 18 displays the same results accordingto the region. These results demonstrate abroadly similar pattern to the overall findings:there was no increase in variability of historicallycontrolled <strong>studies</strong> compared with RCTs and asystematic bias in six of the eight regions infavour of carotid surgery. There was variability inthe average magnitude of the bias by region(Region 1 showing the largest overestimateof harm and Region 8 showing the largestoverestimate of benefit). There was notableheterogeneity in the results of the RCTs between


