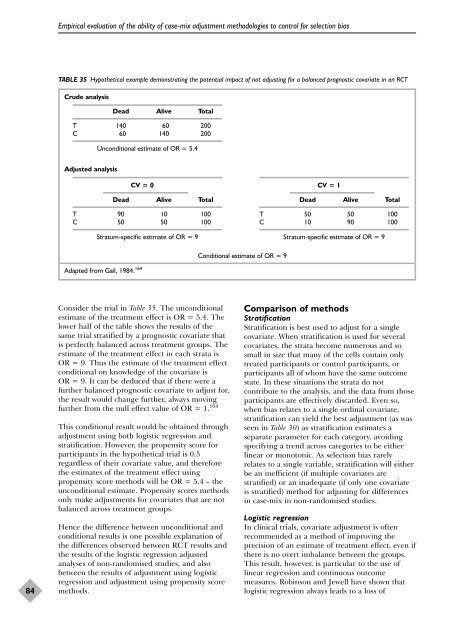
Empirical evaluation of the ability of case-mix adjustment methodologies to control for selection biasTABLE 35 Hypothetical example demonstrating the potential impact of not adjusting for a balanced prognostic covariate in an RCTCrude analysisDead Alive TotalT 140 60 200C 60 140 200Unconditional estimate of OR = 5.4Adjusted analysisCV = 0Dead Alive TotalT 90 10 100C 50 50 100Stratum-specific estimate of OR = 9CV = 1Dead Alive TotalT 50 50 100C 10 90 100Stratum-specific estimate of OR = 9Conditional estimate of OR = 9Adapted from Gail, 1984. 16484Consider the trial in Table 35. The unconditionalestimate of the treatment effect is OR = 5.4. Thelower half of the table shows the results of thesame trial stratified by a prognostic covariate thatis perfectly balanced across treatment groups. Theestimate of the treatment effect in each strata isOR = 9. Thus the estimate of the treatment effectconditional on knowledge of the covariate isOR = 9. It can be deduced that if there were afurther balanced prognostic covariate to adjust for,the result would change further, always movingfurther from the null effect value of OR = 1. 164This conditional result would be obtained throughadjustment using both logistic regression andstratification. However, the propensity score forparticipants in the hypothetical trial is 0.5regardless of their covariate value, and thereforethe estimates of the treatment effect usingpropensity score methods will be OR = 5.4 – theunconditional estimate. Propensity scores methodsonly make adjustments for covariates that are notbalanced across treatment groups.Hence the difference between unconditional andconditional results is one possible explanation ofthe differences observed between RCT results andthe results of the logistic regression adjustedanalyses of <strong>non</strong>-<strong>randomised</strong> <strong>studies</strong>, and alsobetween the results of adjustment using logisticregression and adjustment using propensity scoremethods.Comparison of methodsStratificationStratification is best used to adjust for a singlecovariate. When stratification is used for severalcovariates, the strata become numerous and sosmall in size that many of the cells contain onlytreated participants or control participants, orparticipants all of whom have the same outcomestate. In these situations the strata do notcontribute to the analysis, and the data from thoseparticipants are effectively discarded. Even so,when bias relates to a single ordinal covariate,stratification can yield the best adjustment (as wasseen in Table 30) as stratification estimates aseparate parameter for each category, avoidingspecifying a trend across categories to be eitherlinear or monotonic. As selection bias rarelyrelates to a single variable, stratification will eitherbe an inefficient (if multiple covariates arestratified) or an inadequate (if only one covariateis stratified) method for adjusting for differencesin case-mix in <strong>non</strong>-<strong>randomised</strong> <strong>studies</strong>.Logistic regressionIn clinical trials, covariate adjustment is oftenrecommended as a method of improving theprecision of an estimate of treatment effect, even ifthere is no overt imbalance between the groups.This result, however, is particular to the use oflinear regression and continuous outcomemeasures. Robinson and Jewell have shown thatlogistic regression always leads to a loss of
<strong>Health</strong> Technology Assessment 2003; Vol. 7: No. 27precision. 151 Their theoretical finding explains theincreased variability of adjusted results that weobserved with all applications of logisticregression, which we have interpreted as increasedunpredictability in bias. However, unlike theincreased variability observed with historically andconcurrently controlled <strong>non</strong>-<strong>randomised</strong> <strong>studies</strong> inChapter 6, the standard errors of the adjustedestimates are also inflated, such that the extraincreased variability does not further increasespurious statistical significance rates.One dilemma in all regression models is the processby which covariates are selected for adjustment.Many texts discuss the importance of combiningclinical judgement and empirical methods toensure that the models select and code variables inways that have clinical face validity. There arethree strategies that are commonly used in healthcare research to achieve this, described below.Recently there has been a trend to include allscientifically relevant variables in the model,irrespective of their contribution to the model. 166The rationale for this approach is to provide ascomplete control of confounding as possiblewithin the given data set. This idea is based on thefact that it is possible for individual variables notto exhibit strong confounding, but when takencollectively considerable confounding can bepresent in the data. One major problem with thisapproach is that the model may be overfitted andproduce numerically unstable estimates. However,as we have observed, a more important problemmay be the increased risk of including covariateswith correlated misclassification errors.The stepwise approaches to selecting covariatesare often criticised for using statistical significanceto assess the adequacy of a model rather thanjudging the need to control for specific factors onthe basis of the extent of confounding involved,and in using sequential statistical testing, known tolead to bias. 167 Research based on simulations hasfound that stepwise selection strategies which usehigher p-values (0.15–0.20) are more likely tocorrectly select confounding factors than thosewhich use a p-value of 0.05. 168,169 In ourevaluations, little practical difference was observedbetween these two stepwise strategies.A pragmatic strategy for deciding which estimatesto adjust for involves undertaking unadjusted andadjusted analyses and using the results of theadjusted analysis when they differ from those ofthe unadjusted analysis. This is based on anargument that if the adjustment for a covariatedoes not alter the treatment effect the covariate isunlikely to be important. 141 An extension of thisargument is used to determine when all necessaryconfounders have been included in the model,suggesting that confounders should keep beingadded to a model so long as the adjusted effectkeeps changing (e.g. by at least 10%). Theassumed rationale for this strategy sometimesmisleads analysts to reach the unjustifiedconclusion that when estimates become stable allimportant confounders have been adjusted for,such that the adjusted estimate of the treatmenteffect is unbiased. We did not attempt to automatethis variable selection approach in our evaluations.Propensity score methodsPropensity score methods are not widely used inhealthcare research, and are difficult to undertakeowing to the lack of suitable software routines.However, there may be benefits of the propensityscore approach over traditional approaches inmaking adjustments in <strong>non</strong>-<strong>randomised</strong> <strong>studies</strong>.Whilst Rosenbaum and Rubin showed that for biasintroduced through a single covariate thepropensity score approach is equivalent to directadjustment through the covariate, 146 our analyseshave shown that when there are multiplecovariates the propensity score method may in factbe superior as it does not increase variability inthe estimates. In addition, propensity scoremethods give unconditional (or populationaverage) estimates of treatment effects, which aremore comparable to typical analyses of RCTs.Simulation <strong>studies</strong> have also shown that propensityscores are less biased than direct adjustmentmethods when the relationship of covariates ismisspecified. 170The impact of misclassification and measurementerror on propensity score methods appears not tohave been studied. It is unclear whether theseproblems can explain the occasionalovercorrection of propensity score methods thatwe observed. Also, our implementation of thepropensity score method did not includeinteraction terms in the estimation of propensityscores, as is sometimes recommended. 147 It wouldbe interesting to evaluate whether includingadditional terms would have improved theperformance of the model.ConclusionsThe problems of underadjustment forconfounding are well recognised. However, in a<strong>non</strong>-<strong>randomised</strong> study it is not possible to assess85© Queen’s Printer and Controller of HMSO 2003. All rights reserved.


