

Evaluating non-randomised intervention studies - NIHR Health ...
Evaluating non-randomised intervention studies - NIHR Health ...
Evaluating non-randomised intervention studies - NIHR Health ...

Create successful ePaper yourself
Turn your PDF publications into a flip-book with our unique Google optimized e-Paper software.
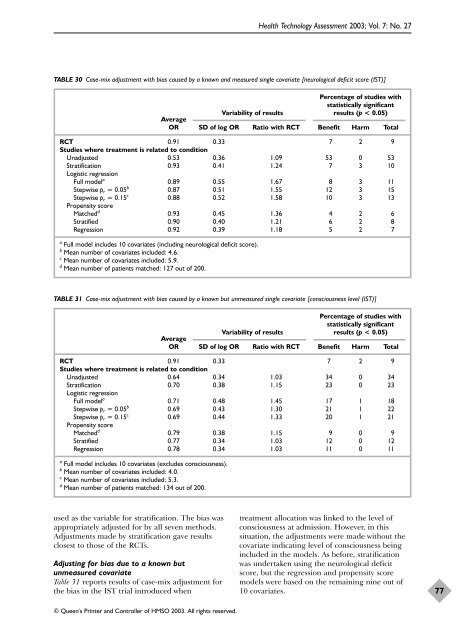
<strong>Health</strong> Technology Assessment 2003; Vol. 7: No. 27TABLE 30 Case-mix adjustment with bias caused by a known and measured single covariate [neurological deficit score (IST)]Percentage of <strong>studies</strong> withstatistically significantAverageVariability of results results (p < 0.05)OR SD of log OR Ratio with RCT Benefit Harm TotalRCT 0.91 0.33 7 2 9Studies where treatment is related to conditionUnadjusted 0.53 0.36 1.09 53 0 53Stratification 0.93 0.41 1.24 7 3 10Logistic regressionFull model a 0.89 0.55 1.67 8 3 11Stepwise p r = 0.05 b 0.87 0.51 1.55 12 3 15Stepwise p r = 0.15 c 0.88 0.52 1.58 10 3 13Propensity scoreMatched d 0.93 0.45 1.36 4 2 6Stratified 0.90 0.40 1.21 6 2 8Regression 0.92 0.39 1.18 5 2 7a Full model includes 10 covariates (including neurological deficit score).b Mean number of covariates included: 4.6.c Mean number of covariates included: 5.9.d Mean number of patients matched: 127 out of 200.TABLE 31 Case-mix adjustment with bias caused by a known but unmeasured single covariate [consciousness level (IST)]Percentage of <strong>studies</strong> withstatistically significantAverageVariability of results results (p < 0.05)OR SD of log OR Ratio with RCT Benefit Harm TotalRCT 0.91 0.33 7 2 9Studies where treatment is related to conditionUnadjusted 0.64 0.34 1.03 34 0 34Stratification 0.70 0.38 1.15 23 0 23Logistic regressionFull model a 0.71 0.48 1.45 17 1 18Stepwise p r = 0.05 b 0.69 0.43 1.30 21 1 22Stepwise p r = 0.15 c 0.69 0.44 1.33 20 1 21Propensity scoreMatched d 0.79 0.38 1.15 9 0 9Stratified 0.77 0.34 1.03 12 0 12Regression 0.78 0.34 1.03 11 0 11a Full model includes 10 covariates (excludes consciousness).b Mean number of covariates included: 4.0.c Mean number of covariates included: 5.3.d Mean number of patients matched: 134 out of 200.used as the variable for stratification. The bias wasappropriately adjusted for by all seven methods.Adjustments made by stratification gave resultsclosest to those of the RCTs.Adjusting for bias due to a known butunmeasured covariateTable 31 reports results of case-mix adjustment forthe bias in the IST trial introduced whentreatment allocation was linked to the level ofconsciousness at admission. However, in thissituation, the adjustments were made without thecovariate indicating level of consciousness beingincluded in the models. As before, stratificationwas undertaken using the neurological deficitscore, but the regression and propensity scoremodels were based on the remaining nine out of10 covariates.77© Queen’s Printer and Controller of HMSO 2003. All rights reserved.


