

Evaluating non-randomised intervention studies - NIHR Health ...
Evaluating non-randomised intervention studies - NIHR Health ...
Evaluating non-randomised intervention studies - NIHR Health ...

You also want an ePaper? Increase the reach of your titles
YUMPU automatically turns print PDFs into web optimized ePapers that Google loves.
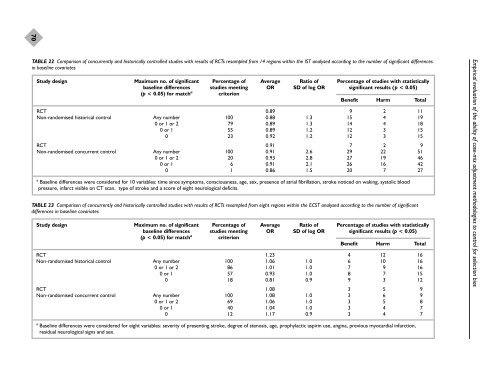
70TABLE 22 Comparison of concurrently and historically controlled <strong>studies</strong> with results of RCTs resampled from 14 regions within the IST analysed according to the number of significant differencesin baseline covariatesStudy design Maximum no. of significant Percentage of Average Ratio of Percentage of <strong>studies</strong> with statisticallybaseline differences <strong>studies</strong> meeting OR SD of log OR significant results (p < 0.05)(p < 0.05) for match a criterionBenefit Harm TotalRCT 0.89 9 2 11Non-<strong>randomised</strong> historical control Any number 100 0.88 1.3 15 4 190 or 1 or 2 79 0.89 1.3 14 4 180 or 1 55 0.89 1.2 12 3 150 23 0.92 1.2 12 3 15RCT 0.91 7 2 9Non-<strong>randomised</strong> concurrent control Any number 100 0.91 2.6 29 22 510 or 1 or 2 20 0.93 2.8 27 19 460 or 1 6 0.91 2.1 26 16 420 1 0.86 1.5 20 7 27a Baseline differences were considered for 10 variables: time since symptoms, consciousness, age, sex, presence of atrial fibrillation, stroke noticed on waking, systolic bloodpressure, infarct visible on CT scan, type of stroke and a score of eight neurological deficits.TABLE 23 Comparison of concurrently and historically controlled <strong>studies</strong> with results of RCTs resampled from eight regions within the ECST analysed according to the number of significantdifferences in baseline covariatesStudy design Maximum no. of significant Percentage of Average Ratio of Percentage of <strong>studies</strong> with statisticallybaseline differences <strong>studies</strong> meeting OR SD of log OR significant results (p < 0.05)(p < 0.05) for match a criterionBenefit Harm TotalRCT 1.23 4 12 16Non-<strong>randomised</strong> historical control Any number 100 1.06 1.0 6 10 160 or 1 or 2 86 1.01 1.0 7 9 160 or 1 57 0.93 1.0 8 7 150 18 0.81 0.9 9 3 12RCT 1.08 3 5 9Non-<strong>randomised</strong> concurrent control Any number 100 1.08 1.0 3 6 90 or 1 or 2 69 1.06 1.0 3 5 80 or 1 40 1.04 1.0 3 4 70 12 1.17 0.9 3 4 7Empirical evaluation of the ability of case-mix adjustment methodologies to control for selection biasa Baseline differences were considered for eight variables: severity of presenting stroke, degree of stenosis, age, prophylactic aspirin use, angina, previous myocardial infarction,residual neurological signs and sex.


