- Page 2 and 3:
Computer Modellingin Molecular Biol
- Page 5 and 6:
Professor Julia M. GoodfellowDepart
- Page 7 and 8:
ContentsColour Illustrations ......
- Page 9 and 10:
XContributorsBenoit RouxGroupe de R
- Page 11:
Colour IllustrationsXI11Figure 4-4.
- Page 14 and 15:
XVIColour IllustrationsFigure 7-18.
- Page 16 and 17:
2 Julia M. Goodfellow and Mark A. W
- Page 18 and 19:
4 Julia M. Goodfellow and Mark A. W
- Page 20 and 21:
6 Julia M. Goodfellow and Mark A. W
- Page 22 and 23:
Computer Modelling in Molecular Bio
- Page 24 and 25:
2 Modellinn Protein Structures 11su
- Page 26 and 27:
2 Modelling Protein Structures 13St
- Page 28 and 29:
2 Modelling Protein Structures 15Th
- Page 30 and 31:
2 Modelling Protein Structures 17Th
- Page 32 and 33:
2 Modelling Protein Structures 19Fa
- Page 34 and 35:
2 Modellinn Protein Structures 21th
- Page 36 and 37:
2 Modelling Protein Structures 23ho
- Page 38 and 39:
2 Modelling Protein Structures 25Wo
- Page 40 and 41:
2 Modelling Protein Structures 271.
- Page 42 and 43:
2.3.3 Available Modelling Programs2
- Page 44 and 45:
2 Modelling Protein Structures 31sp
- Page 46 and 47:
2 Modellina Protein Structures 33Ac
- Page 48 and 49:
2 Modelling Protein Structures 35[8
- Page 50 and 51:
38 D. J Osmthorue and I? K. C Paul3
- Page 52 and 53:
40 D. J; Osnuthorue and I? K. C. Pa
- Page 54 and 55:
42 D. J. OsPuthorDe and J? K. C Pau
- Page 56 and 57:
~443.3.1D. J. Osnuthorpe and I? K.
- Page 58 and 59:
46 D. 1 Osnuthorpe and r! K. C. Pau
- Page 60 and 61:
48 D. J. Osguthorpe and I? K. C. Pa
- Page 62 and 63:
50 D. J. Osguthorpe and I? K. C. Pa
- Page 64 and 65:
52 D. J. Osguthorpe and I! K. C. Pa
- Page 66 and 67:
54 D. L Osguthorpe and I! K. C Paul
- Page 68 and 69:
56 D. J Osguthorpe and I? K. C. Pau
- Page 70 and 71:
58 D. J. Osguthorpe and r! K. C. Pa
- Page 72 and 73:
Computer Modelling in Molecular Bio
- Page 74 and 75:
4 Molecular Dynamics and Free Energ
- Page 76 and 77:
4 Molecular Dynamics and Free Energ
- Page 78 and 79:
4 Molecular Dynamics and Free Energ
- Page 80 and 81:
4 Molecular Dvnamics and Free Enera
- Page 82 and 83:
4 Molecular Dynamics and Free Energ
- Page 84 and 85:
4 Molecular Dynamics and Free Energ
- Page 86 and 87:
4 Molecular Dynamics and Free Energ
- Page 88 and 89:
4 Molecular Dynamics and Free Energ
- Page 90 and 91:
4 Molecular Dynamics and Free Energ
- Page 92 and 93:
4 Molecular Dynamics and Free Energ
- Page 94 and 95:
4 Molecular Dynamics and Free Enerw
- Page 96 and 97:
4 Molecular Dynamics and Free Energ
- Page 98 and 99:
4 Molecular Dynamics and Free Energ
- Page 100 and 101:
4 Molecular Dynamics and Free Energ
- Page 102 and 103:
4 Molecular Dynamics and Free Energ
- Page 104 and 105:
4 Molecular Dynamics and Free Enern
- Page 106 and 107:
4 Molecular Dynamics and Free Energ
- Page 108 and 109:
4 Molecular Dynamics and Free Energ
- Page 110 and 111:
4 Molecular Dynamics and Free Energ
- Page 112 and 113:
4 Molecular Dynamics and Free Energ
- Page 114 and 115:
Computer Modelling in Molecular Bio
- Page 116 and 117:
5 Modelling Nucleic Acids 105and it
- Page 118 and 119:
5 Modelling Nucleic Acids 107of the
- Page 120 and 121:
5 Modelling Nucleic Acids 109ElFigu
- Page 122 and 123:
5 Modelling Nucleic Acids 11 1Figur
- Page 124 and 125:
5 Modellinn Nucleic Acids 1135.7 Ch
- Page 126 and 127:
5 Modelling Nucleic Acids 115With i
- Page 128 and 129:
5 Modellinn Nucleic Acids 117Figure
- Page 130 and 131:
5 Modelling Nucleic Acids 119Figure
- Page 132 and 133:
5 Modelling Nucleic Acids 1211.0mod
- Page 134 and 135:
5 Modelling Nucleic Acids 1235.12 M
- Page 136 and 137:
5 Modelling Nucleic Acids 125rotati
- Page 138 and 139:
5 Modellinp Nucleic Acids 1275.14 M
- Page 140 and 141:
5 Modelling Nucleic Acids 129simula
- Page 142 and 143:
5 Modellinn Nucleic Acids 131[40] G
- Page 144 and 145:
134 Benoft Roux6.1 IntroductionThe
- Page 146 and 147:
136 Benoit Roux[18-201. The gramici
- Page 148 and 149:
138 Benoft Rouxwhere D (x) is the l
- Page 150 and 151:
140 Benoft Roux“one-ion” conduc
- Page 152 and 153:
142 Benoft RouxTable 6-1. Interacti
- Page 154 and 155:
144 Benoit RouxFigure 6-2. Solvated
- Page 156 and 157:
146 Benoit Rouxwater box equilibrat
- Page 158 and 159:
148 Benoit Roux-I I I I II I I I II
- Page 160 and 161:
150 Benoi’t Rouxbulk waters. A st
- Page 162 and 163:
152 Benoit RouxOne advantage of thi
- Page 164 and 165:
154 Benoft Roux-.3.-15-c 10 -h5 5 -
- Page 166 and 167:
156 Benoft Rouxwhere x and v are th
- Page 168 and 169:
158 Benoit RouxReactant to ProductO
- Page 170 and 171:
160 Benoit Rouxremain in close cont
- Page 172 and 173:
162 Benoit Rouxis the deviation of
- Page 174 and 175:
164 Benoft RouxTable 6-3. Pre-expon
- Page 176 and 177:
166 Benoft RouxThis chapter demonst
- Page 178 and 179:
168 Benoft Rouxproximately one Kf c
- Page 180 and 181:
Computer Modelling in Molecular Bio
- Page 182 and 183:
7 Major Histocompatibility Complex
- Page 184 and 185:
7 Major HistocompatibiIity Complex
- Page 186 and 187:
7 Maior Histocompatibility Complex
- Page 188 and 189:
7 Major Histocompatibility Complex
- Page 190 and 191:
7 Major Histocompatibility Complex
- Page 192 and 193: 7 Maior Histocomuatibilitv Cornulex
- Page 194 and 195: 7 Major Histocompatibility Complex
- Page 196 and 197: 7 Major Histocompatibility Complex
- Page 198 and 199: 7 Major Histocompatibility Complex
- Page 200 and 201: 7 Major Histocompatibility Complex
- Page 202 and 203: 7 Major Histocompatibility Complex
- Page 204 and 205: 7 Major Histocompatibility Complex
- Page 206 and 207: 7 Major Histocompatibility Complex
- Page 208 and 209: 7 Major Histocompatibility Complex
- Page 210 and 211: HLA-B*270 IHLA-B*2702HLA-B*2703HLA-
- Page 212 and 213: 7 Maior Histocomvatibilitv Comrdex
- Page 214 and 215: 7 Major Histocompatibility Complex
- Page 216 and 217: 7 Major Histocompatibility Complex
- Page 218 and 219: 7 Major Histocompatibility Complex
- Page 220 and 221: 7 Major Histocompatibility Complex
- Page 222 and 223: 7 Major Histocompatibility Complex
- Page 224 and 225: 216 Oliver S. Smart8.1 Introduction
- Page 226 and 227: 218 Oliver S. Smartvolving large mo
- Page 228 and 229: 220 Oliver S. Smart8.2 TheoryConsid
- Page 230 and 231: 222 Oliver S. Smart(8-2)and applyin
- Page 232 and 233: 224 Oliver S. SmartThe repulsion te
- Page 234 and 235: 226 Oliver S. Smart8.4 Applications
- Page 236 and 237: 228 Oliver S. Smartrigid-body penal
- Page 238 and 239: 230 Oliver S. Smart216 252 200 324
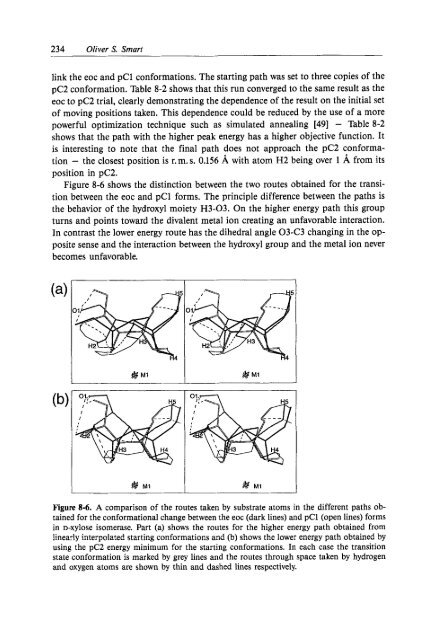
- Page 240 and 241: 232 Oliver S. SmartrbFigure 8-5. A
- Page 244 and 245: 236 Oliver S. Smarttermediates mark
- Page 246 and 247: 238 Oliver S. Smartmoving conformat
- Page 248 and 249: 240 Oliver S. Smart[39] Halgren, T.
- Page 250 and 251: 242 IndexGGramicidin A 134- NMR dat