computer modeling in molecular biology.pdf
computer modeling in molecular biology.pdf
computer modeling in molecular biology.pdf

Create successful ePaper yourself
Turn your PDF publications into a flip-book with our unique Google optimized e-Paper software.
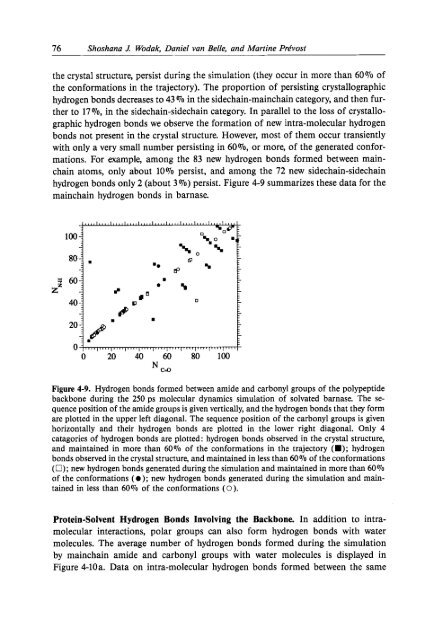
76 Shoshana .I Wodak, Daniel van Belle, and Mart<strong>in</strong>e Prtfvostthe crystal structure, persist dur<strong>in</strong>g the simulation (they occur <strong>in</strong> more than 60% ofthe conformations <strong>in</strong> the trajectory). The proportion of persist<strong>in</strong>g crystallographichydrogen bonds decreases to 43 (70 <strong>in</strong> the sidecha<strong>in</strong>-ma<strong>in</strong>cha<strong>in</strong> category, and then furtherto 17 %, <strong>in</strong> the sidecha<strong>in</strong>-sidecha<strong>in</strong> category. In parallel to the loss of crystallographichydrogen bonds we observe the formation of new <strong>in</strong>tra-<strong>molecular</strong> hydrogenbonds not present <strong>in</strong> the crystal structure. However, most of them occur transientlywith only a very small number persist<strong>in</strong>g <strong>in</strong> 6O%, or more, of the generated conformations.For example, among the 83 new hydrogen bonds formed between ma<strong>in</strong>cha<strong>in</strong>atoms, only about 10% persist, and among the 72 new sidecha<strong>in</strong>-sidecha<strong>in</strong>hydrogen bonds only 2 (about 3 070) persist. Figure 4-9 summarizes these data for thema<strong>in</strong>cha<strong>in</strong> hydrogen bonds <strong>in</strong> barnase.Figure 4-9. Hydrogen bonds formed between amide and carbonyl groups of the polypeptidebackbone dur<strong>in</strong>g the 250 ps <strong>molecular</strong> dynamics simulation of solvated barnase. The sequenceposition of the amide groups is given vertically, and the hydrogen bonds that they formare plotted <strong>in</strong> the upper left diagonal. The sequence position of the carbonyl groups is givenhorizontally and their hydrogen bonds are plotted <strong>in</strong> the lower right diagonal. Only 4catagories of hydrogen bonds are plotted: hydrogen bonds observed <strong>in</strong> the crystal structure,and ma<strong>in</strong>ta<strong>in</strong>ed <strong>in</strong> more than 60% of the conformations <strong>in</strong> the trajectory (B); hydrogenbonds observed <strong>in</strong> the crystal structure, and ma<strong>in</strong>ta<strong>in</strong>ed <strong>in</strong> less than 60% of the conformations(0); new hydrogen bonds generated dur<strong>in</strong>g the simulation and ma<strong>in</strong>ta<strong>in</strong>ed <strong>in</strong> more than 60%of the conformations (a); new hydrogen bonds generated dur<strong>in</strong>g the simulation and ma<strong>in</strong>ta<strong>in</strong>ed<strong>in</strong> less than 60% of the conformations (0).Prote<strong>in</strong>-Solvent Hydrogen Bonds Involv<strong>in</strong>g the Backbone. In addition to <strong>in</strong>tra<strong>molecular</strong><strong>in</strong>teractions, polar groups can also form hydrogen bonds with watermolecules. The average number of hydrogen bonds formed dur<strong>in</strong>g the simulationby ma<strong>in</strong>cha<strong>in</strong> amide and carbonyl groups with water molecules is displayed <strong>in</strong>Figure 4-10a. Data on <strong>in</strong>tra-<strong>molecular</strong> hydrogen bonds formed between the same