- Page 2:
TransesophagealEchocardiographyMult
- Page 5 and 6:
Published in 2005 byTaylor & Franci
- Page 10:
ForewordThe use of transesophageal
- Page 13 and 14:
xPrefaceThere are several other ind
- Page 16 and 17:
ContentsForeword Jean-Francois Hard
- Page 18 and 19:
ContributorsRobert Amyot, MD, FRCPC
- Page 20:
ContributorsxviiFrançois Marcotte,
- Page 23 and 24:
xxAbbreviationsCNS central nervous
- Page 25 and 26:
xxiiAbbreviationsPMLPpaPPHPPHTNPraP
- Page 28 and 29:
How to Use the Transesophageal Echo
- Page 30 and 31:
1Principles of UltrasoundALAIN GAUV
- Page 32 and 33:
Principles of Ultrasound 3Table 1.1
- Page 34 and 35:
Principles of Ultrasound 5the ratio
- Page 36 and 37:
Principles of Ultrasound 7transduce
- Page 38 and 39:
Principles of Ultrasound 9(A)(B)Fig
- Page 40 and 41:
Principles of Ultrasound 11certain
- Page 42 and 43:
Principles of Ultrasound 13PULSERBE
- Page 44 and 45:
Principles of Ultrasound 152. Trans
- Page 46 and 47:
Principles of Ultrasound 17(A)(B)TV
- Page 48 and 49:
Principles of Ultrasound 19(A)(B)(E
- Page 50:
Principles of Ultrasound 21to the i
- Page 53 and 54:
24 Transesophageal Echocardiography
- Page 55 and 56:
26 Transesophageal Echocardiography
- Page 57 and 58:
28 Transesophageal Echocardiography
- Page 59 and 60:
30 Transesophageal Echocardiography
- Page 61 and 62:
32 Transesophageal Echocardiography
- Page 63 and 64:
34 Transesophageal Echocardiography
- Page 65 and 66:
36 Transesophageal Echocardiography
- Page 67 and 68:
38 Transesophageal Echocardiography
- Page 70 and 71:
3TransducersFRANÇOIS HADDADUnivers
- Page 72 and 73:
Transducers 43(A)(C)(B)Figure 3.3 (
- Page 74 and 75:
Transducers 45more frequencies than
- Page 76 and 77:
Transducers 47Figure 3.10 Beam focu
- Page 78 and 79:
Transducers 49sound that propagate
- Page 80 and 81:
Transducers 51(A)(B)(C)Figure 3.15
- Page 83 and 84:
54 Transesophageal Echocardiography
- Page 85 and 86:
56 Transesophageal Echocardiography
- Page 87 and 88:
58 Transesophageal Echocardiography
- Page 89 and 90:
60 Transesophageal Echocardiography
- Page 91 and 92:
62 Transesophageal Echocardiography
- Page 93 and 94:
64 Transesophageal Echocardiography
- Page 95 and 96:
66 Transesophageal Echocardiography
- Page 97 and 98:
68 Transesophageal Echocardiography
- Page 99 and 100:
70 Transesophageal Echocardiography
- Page 101 and 102:
72 Transesophageal Echocardiography
- Page 103 and 104:
74 Transesophageal Echocardiography
- Page 105 and 106:
76 Transesophageal Echocardiography
- Page 107 and 108:
78 Transesophageal Echocardiography
- Page 109 and 110:
80 Transesophageal Echocardiography
- Page 111 and 112:
82 Transesophageal Echocardiography
- Page 113 and 114:
84 Transesophageal Echocardiography
- Page 115 and 116:
86 Transesophageal Echocardiography
- Page 118 and 119:
5Quantitative EchocardiographyJEAN
- Page 120 and 121:
Quantitative Echocardiography 91dim
- Page 122 and 123:
Quantitative Echocardiography 93Fig
- Page 124 and 125:
Quantitative Echocardiography 95Fig
- Page 126 and 127:
Quantitative Echocardiography 97Fig
- Page 128 and 129:
Quantitative Echocardiography 99Fig
- Page 130 and 131:
Quantitative Echocardiography 101Fi
- Page 132 and 133:
Quantitative Echocardiography 103Fi
- Page 134 and 135:
Quantitative Echocardiography 105in
- Page 136 and 137:
Quantitative Echocardiography 107Fi
- Page 138 and 139:
Quantitative Echocardiography 109Fi
- Page 140 and 141:
Quantitative Echocardiography 111Fi
- Page 142 and 143:
Quantitative Echocardiography 113Fi
- Page 144 and 145:
Quantitative Echocardiography 115On
- Page 146 and 147:
Quantitative Echocardiography 117Ha
- Page 148 and 149:
Quantitative Echocardiography 119fl
- Page 150 and 151:
6Imaging Artifacts and PitfallsROBE
- Page 152 and 153:
Imaging Artifacts and Pitfalls 123F
- Page 154 and 155:
Imaging Artifacts and Pitfalls 125F
- Page 156 and 157:
Imaging Artifacts and Pitfalls 127(
- Page 158 and 159:
Imaging Artifacts and Pitfalls 129(
- Page 160 and 161:
Imaging Artifacts and Pitfalls 131(
- Page 162 and 163:
Imaging Artifacts and Pitfalls 133(
- Page 164 and 165:
Imaging Artifacts and Pitfalls 135(
- Page 166 and 167:
Imaging Artifacts and Pitfalls 137(
- Page 168:
Imaging Artifacts and Pitfalls 1391
- Page 171 and 172:
142 Transesophageal Echocardiograph
- Page 173 and 174:
144 Transesophageal Echocardiograph
- Page 175 and 176:
146 Transesophageal Echocardiograph
- Page 177 and 178:
148 Transesophageal Echocardiograph
- Page 179 and 180:
150 Transesophageal Echocardiograph
- Page 181 and 182:
152 Transesophageal Echocardiograph
- Page 183 and 184:
154 Transesophageal Echocardiograph
- Page 185 and 186:
156 Transesophageal Echocardiograph
- Page 187 and 188:
158 Transesophageal Echocardiograph
- Page 189 and 190:
160 Transesophageal Echocardiograph
- Page 191 and 192:
162 Transesophageal Echocardiograph
- Page 193 and 194:
164 Transesophageal Echocardiograph
- Page 195 and 196:
166 Transesophageal Echocardiograph
- Page 197 and 198:
168 Transesophageal Echocardiograph
- Page 199 and 200:
170 Transesophageal Echocardiograph
- Page 201 and 202:
172 Transesophageal Echocardiograph
- Page 203 and 204:
174 Transesophageal Echocardiograph
- Page 205 and 206:
176 Transesophageal Echocardiograph
- Page 207 and 208:
178 Transesophageal Echocardiograph
- Page 209 and 210:
180 Transesophageal Echocardiograph
- Page 211 and 212:
182 Transesophageal Echocardiograph
- Page 214 and 215:
9Global Ventricular Function and He
- Page 216 and 217:
Global Ventricular Function and Hem
- Page 218 and 219:
Global Ventricular Function and Hem
- Page 220 and 221:
Global Ventricular Function and Hem
- Page 222 and 223:
Global Ventricular Function and Hem
- Page 224 and 225:
Global Ventricular Function and Hem
- Page 226 and 227:
Global Ventricular Function and Hem
- Page 228 and 229:
Global Ventricular Function and Hem
- Page 230 and 231:
Global Ventricular Function and Hem
- Page 232 and 233:
Global Ventricular Function and Hem
- Page 234 and 235:
Global Ventricular Function and Hem
- Page 236 and 237:
Global Ventricular Function and Hem
- Page 238 and 239:
Global Ventricular Function and Hem
- Page 240 and 241:
Global Ventricular Function and Hem
- Page 242 and 243:
Global Ventricular Function and Hem
- Page 244 and 245:
10CardiomyopathyVICKY SOULIÈRE, PH
- Page 246 and 247:
Cardiomyopathy 217Figure 10.1 (A, B
- Page 248 and 249:
Cardiomyopathy 219Figure 10.4 Systo
- Page 250 and 251:
Cardiomyopathy 221RVOT must also be
- Page 252 and 253:
Cardiomyopathy 223either by reduced
- Page 254 and 255:
Cardiomyopathy 225Figure 10.10 Flow
- Page 256 and 257:
Cardiomyopathy 227On the other hand
- Page 258 and 259:
Cardiomyopathy 229volumes are both
- Page 260 and 261:
Cardiomyopathy 231(A)TMFAE(B)PVFDMe
- Page 262 and 263:
Cardiomyopathy 233(A)(B)LUPVLAAoLAA
- Page 264 and 265:
Cardiomyopathy 235(A)(B)LALV(C)Figu
- Page 266 and 267:
Cardiomyopathy 237than moderate MR
- Page 268:
Cardiomyopathy 23920. Yu EH, Omran
- Page 271 and 272:
242 Transesophageal Echocardiograph
- Page 273 and 274:
244 Transesophageal Echocardiograph
- Page 275 and 276:
246 Transesophageal Echocardiograph
- Page 277 and 278:
248 Transesophageal Echocardiograph
- Page 279 and 280:
250 Transesophageal Echocardiograph
- Page 281 and 282:
252 Transesophageal Echocardiograph
- Page 283 and 284:
254 Transesophageal Echocardiograph
- Page 285 and 286:
256 Transesophageal Echocardiograph
- Page 287 and 288:
258 Transesophageal Echocardiograph
- Page 290 and 291:
12AortaIVAN IGLESIAS, DANIEL BAINBR
- Page 292 and 293:
Aorta 263GRADE 1:NORMALAoGRADE 2:IN
- Page 294 and 295:
Aorta 265(A)(B)LALMCARAAoRVRCAFigur
- Page 296 and 297:
Aorta 267Figure 12.9Short- (A, B) a
- Page 298 and 299:
Aorta 269(A)(B)AORTAMOBILEATHEROMA(
- Page 300 and 301:
Aorta 271diameter (22). Aneurysms o
- Page 302 and 303:
Aorta 273(A)(B)NCCRALARCCMPALCCANEU
- Page 304 and 305:
Aorta 275(A)(B)LAARTEFACT(C)AoARTEF
- Page 306 and 307:
Aorta 277(A)(B)AoLATVRAFL TLPVRV(C)
- Page 308 and 309:
Aorta 279(A)(B)AORTICHEMATOMAAo(C)A
- Page 310 and 311:
Aorta 281(A)(B)FLTLAo(C)(D)INTRALUM
- Page 312:
Aorta 28331. Bansal RC, Chandraseka
- Page 315 and 316: 286 Transesophageal Echocardiograph
- Page 317 and 318: 288 Transesophageal Echocardiograph
- Page 319 and 320: 290 Transesophageal Echocardiograph
- Page 321 and 322: 292 Transesophageal Echocardiograph
- Page 323 and 324: 294 Transesophageal Echocardiograph
- Page 325 and 326: 296 Transesophageal Echocardiograph
- Page 327 and 328: 298 Transesophageal Echocardiograph
- Page 329 and 330: 300 Transesophageal Echocardiograph
- Page 331 and 332: 302 Transesophageal Echocardiograph
- Page 333 and 334: 304 Transesophageal Echocardiograph
- Page 335 and 336: 306 Transesophageal Echocardiograph
- Page 337 and 338: 308 Transesophageal Echocardiograph
- Page 339 and 340: 310 Transesophageal Echocardiograph
- Page 341 and 342: 312 Transesophageal Echocardiograph
- Page 344 and 345: 14Perioperative Role of TEE in Mech
- Page 346 and 347: TEE in Mechanical Circulatory Assis
- Page 348 and 349: TEE in Mechanical Circulatory Assis
- Page 350 and 351: TEE in Mechanical Circulatory Assis
- Page 352 and 353: TEE in Mechanical Circulatory Assis
- Page 354 and 355: TEE in Mechanical Circulatory Assis
- Page 356 and 357: TEE in Mechanical Circulatory Assis
- Page 358 and 359: 15Native Aortic ValveFRANÇOIS A. B
- Page 360 and 361: Native Aortic Valve 331Figure 15.2
- Page 362 and 363: Native Aortic Valve 333(A)(B)ARANTI
- Page 364 and 365: Native Aortic Valve 335(A) (B) (C)
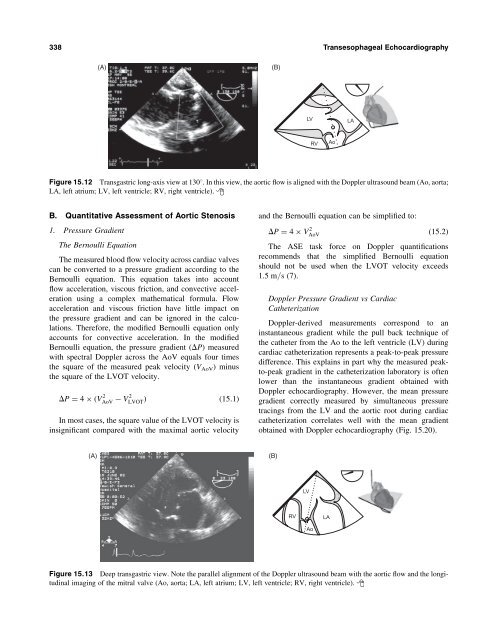
- Page 368 and 369: Native Aortic Valve 339(A)(B)MVAoVL
- Page 370 and 371: Native Aortic Valve 341(A)(B)LAAoVL
- Page 372 and 373: Native Aortic Valve 343(A)(B)SAMLAI
- Page 374 and 375: Native Aortic Valve 345(A)(B)AoVLAT
- Page 376 and 377: Native Aortic Valve 347Although the
- Page 378 and 379: Native Aortic Valve 349substitution
- Page 380 and 381: Native Aortic Valve 351(A)(B)AoVLVO
- Page 382 and 383: Native Aortic Valve 353(A)(B)LARPAL
- Page 384 and 385: Native Aortic Valve 355(A)(B)LAAoVR
- Page 386 and 387: Native Aortic Valve 357In those pat
- Page 388 and 389: Native Aortic Valve 359Table 15.4 E
- Page 390: Native Aortic Valve 36111. Levine R
- Page 393 and 394: 364 Transesophageal Echocardiograph
- Page 395 and 396: 366 Transesophageal Echocardiograph
- Page 397 and 398: 368 Transesophageal Echocardiograph
- Page 399 and 400: 370 Transesophageal Echocardiograph
- Page 401 and 402: 372 Transesophageal Echocardiograph
- Page 403 and 404: 374 Transesophageal Echocardiograph
- Page 405 and 406: 376 Transesophageal Echocardiograph
- Page 407 and 408: 378 Transesophageal Echocardiograph
- Page 409 and 410: 380 Transesophageal Echocardiograph
- Page 412 and 413: 17Mitral ValveANDRÉ SAINT-PIERRELa
- Page 414 and 415: Mitral Valve 385(A)SCHEMATIC VIEW(B
- Page 416 and 417:
Mitral Valve 387Figure 17.5 Echocar
- Page 418 and 419:
Mitral Valve 389(A)(B)LVP3A2LAAA1Fi
- Page 420 and 421:
Mitral Valve 391(A)(B)(C)(D)A1LAP1L
- Page 422 and 423:
Mitral Valve 393(A)(B)LARALVRV(C)(D
- Page 424 and 425:
Mitral Valve 395(A)(B)AoVFLAIL P1LA
- Page 426 and 427:
Mitral Valve 397(A)(B)P3LALVLAAA1(C
- Page 428 and 429:
Mitral Valve 399(A)(B)LALAALV(C)(D)
- Page 430 and 431:
Mitral Valve 401Table 17.3Mitral Re
- Page 432 and 433:
Mitral Valve 403(A)(B)MITRAL VALVEV
- Page 434 and 435:
Mitral Valve 405(A)EKG(B)PVFPaSDRES
- Page 436 and 437:
Mitral Valve 407Table 17.4BVR Echoc
- Page 438 and 439:
Mitral Valve 409Left ventricular sy
- Page 440 and 441:
Mitral Valve 411(A)(B)LALVAoRV(C)TM
- Page 442 and 443:
Mitral Valve 413Table 17.8StenosisT
- Page 444:
Mitral Valve 415identification of a
- Page 447 and 448:
418 Transesophageal Echocardiograph
- Page 449 and 450:
420 Transesophageal Echocardiograph
- Page 451 and 452:
422 Transesophageal Echocardiograph
- Page 453 and 454:
424 Transesophageal Echocardiograph
- Page 455 and 456:
426 Transesophageal Echocardiograph
- Page 457 and 458:
428 Transesophageal Echocardiograph
- Page 459 and 460:
430 Transesophageal Echocardiograph
- Page 461 and 462:
432 Transesophageal Echocardiograph
- Page 463 and 464:
434 Transesophageal Echocardiograph
- Page 465 and 466:
436 Transesophageal Echocardiograph
- Page 467 and 468:
438 Transesophageal Echocardiograph
- Page 469 and 470:
440 Transesophageal Echocardiograph
- Page 471 and 472:
442 Transesophageal Echocardiograph
- Page 473 and 474:
444 Transesophageal Echocardiograph
- Page 476 and 477:
19Pulmonic and Tricuspid ValvesFRAN
- Page 478 and 479:
Pulmonic and Tricuspid Valves 449Ta
- Page 480 and 481:
Pulmonic and Tricuspid Valves 451(A
- Page 482 and 483:
Pulmonic and Tricuspid Valves 453(A
- Page 484 and 485:
Pulmonic and Tricuspid Valves 455(A
- Page 486 and 487:
Pulmonic and Tricuspid Valves 457(A
- Page 488 and 489:
Pulmonic and Tricuspid Valves 459ti
- Page 490 and 491:
Pulmonic and Tricuspid Valves 461(A
- Page 492 and 493:
Pulmonic and Tricuspid Valves 463AN
- Page 494 and 495:
Pulmonic and Tricuspid Valves 465Ta
- Page 496 and 497:
Pulmonic and Tricuspid Valves 467Ta
- Page 498:
Pulmonic and Tricuspid Valves 46939
- Page 501 and 502:
472 Transesophageal Echocardiograph
- Page 503 and 504:
474 Transesophageal Echocardiograph
- Page 505 and 506:
476 Transesophageal Echocardiograph
- Page 507 and 508:
478 Transesophageal Echocardiograph
- Page 509 and 510:
480 Transesophageal Echocardiograph
- Page 511 and 512:
482 Transesophageal Echocardiograph
- Page 513 and 514:
484 Transesophageal Echocardiograph
- Page 515 and 516:
486 Transesophageal Echocardiograph
- Page 517 and 518:
488 Transesophageal Echocardiograph
- Page 519 and 520:
490 Transesophageal Echocardiograph
- Page 521 and 522:
492 Transesophageal Echocardiograph
- Page 523 and 524:
494 Transesophageal Echocardiograph
- Page 526 and 527:
23Intracavitary ContentsMARIA DI LO
- Page 528 and 529:
Intracavitary Contents 499(A)(B)PFO
- Page 530 and 531:
Intracavitary Contents 501(A)(B)LAL
- Page 532 and 533:
Intracavitary Contents 503artery ca
- Page 534 and 535:
Intracavitary Contents 505(A)(B)MYX
- Page 536 and 537:
Intracavitary Contents 507(A)(B)LVL
- Page 538 and 539:
Intracavitary Contents 509(A)(B)THY
- Page 540 and 541:
Intracavitary Contents 511wall clos
- Page 542 and 543:
Intracavitary Contents 513(A)(B)LAR
- Page 544 and 545:
Intracavitary Contents 515(A)(B)PER
- Page 546 and 547:
Intracavitary Contents 517dysfuncti
- Page 548 and 549:
Intracavitary Contents 519endocardi
- Page 550 and 551:
Intracavitary Contents 521and angle
- Page 552:
Intracavitary Contents 52317. Lando
- Page 555 and 556:
526 Transesophageal Echocardiograph
- Page 557 and 558:
528 Transesophageal Echocardiograph
- Page 559 and 560:
530 Transesophageal Echocardiograph
- Page 561 and 562:
532 Transesophageal Echocardiograph
- Page 563 and 564:
534 Transesophageal Echocardiograph
- Page 565 and 566:
536 Transesophageal Echocardiograph
- Page 567 and 568:
538 Transesophageal Echocardiograph
- Page 569 and 570:
540 Transesophageal Echocardiograph
- Page 571 and 572:
542 Transesophageal Echocardiograph
- Page 573 and 574:
544 Transesophageal Echocardiograph
- Page 575 and 576:
546 Transesophageal Echocardiograph
- Page 577 and 578:
548 Transesophageal Echocardiograph
- Page 579 and 580:
550 Transesophageal Echocardiograph
- Page 581 and 582:
552 Transesophageal Echocardiograph
- Page 584 and 585:
25Indications for Perioperative Tra
- Page 586 and 587:
Indications for Perioperative TEE 5
- Page 588 and 589:
Indications for Perioperative TEE 5
- Page 590 and 591:
Indications for Perioperative TEE 5
- Page 592 and 593:
Indications for Perioperative TEE 5
- Page 594 and 595:
Indications for Perioperative TEE 5
- Page 596:
Indications for Perioperative TEE 5
- Page 599 and 600:
570 IndexAortic aneurysmclassificat
- Page 601 and 602:
572 IndexColor jet area, 402Commiss
- Page 603 and 604:
574 IndexHypotension, 491Hypothermi
- Page 605 and 606:
576 IndexMitral valve repair, 394,
- Page 607 and 608:
578 IndexRight atrial thrombus, 517
- Page 609 and 610:
580 IndexTricuspid leafletsanterior