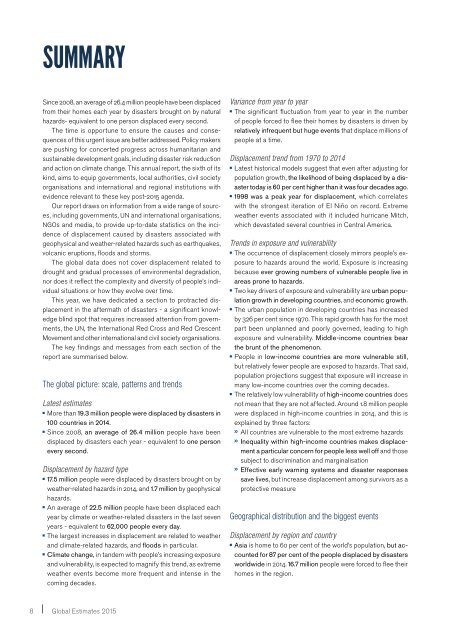
SUMMARYSince 2008, an average of 26.4 million people have been displacedfrom their homes each year by disasters brought on by naturalhazards- equivalent to one person displaced every second.The time is opportune to ensure the causes and consequencesof this urgent issue are better addressed. Policy makersare pushing for concerted progress across humanitarian andsustainable development goals, including disaster risk reductionand action on climate change. This annual report, the sixth of itskind, aims to equip governments, local authorities, civil societyorganisations and international and regional institutions withevidence relevant to these key post-2015 agenda.Our report draws on information from a wide range of sources,including governments, UN and international organisations,NGOs and media, to provide up-to-date statistics on the incidenceof displacement caused by disasters associated withgeophysical and weather-related hazards such as earthquakes,volcanic eruptions, floods and storms.The global data does not cover displacement related todrought and gradual processes of environmental degradation,nor does it reflect the complexity and diversity of people’s individualsituations or how they evolve over time.This year, we have dedicated a section to protracted displacementin the aftermath of disasters - a significant knowledgeblind spot that requires increased attention from governments,the UN, the International Red Cross and Red CrescentMovement and other international and civil society organisations.The key findings and messages from each section of thereport are summarised below.The global picture: scale, patterns and trendsLatest estimatesMore than 19.3 million people were displaced by disasters in100 countries in 2014.Since 2008, an average of 26.4 million people have beendisplaced by disasters each year - equivalent to one personevery second.Displacement by hazard type17.5 million people were displaced by disasters brought on byweather-related hazards in 2014, and 1.7 million by geophysicalhazards.An average of 22.5 million people have been displaced eachyear by climate or weather-related disasters in the last sevenyears - equivalent to 62,000 people every day.The largest increases in displacement are related to weatherand climate-related hazards, and floods in particular.Climate change, in tandem with people’s increasing exposureand vulnerability, is expected to magnify this trend, as extremeweather events become more frequent and intense in thecoming decades.Variance from year to yearThe significant fluctuation from year to year in the numberof people forced to flee their homes by disasters is driven byrelatively infrequent but huge events that displace millions ofpeople at a time.Displacement trend from 1970 to 2014Latest historical models suggest that even after adjusting forpopulation growth, the likelihood of being displaced by a disastertoday is 60 per cent higher than it was four decades ago.1998 was a peak year for displacement, which correlateswith the strongest iteration of El Niño on record. Extremeweather events associated with it included hurricane Mitch,which devastated several countries in Central America.Trends in exposure and vulnerabilityThe occurrence of displacement closely mirrors people’s exposureto hazards around the world. Exposure is increasingbecause ever growing numbers of vulnerable people live inareas prone to hazards.Two key drivers of exposure and vulnerability are urban populationgrowth in developing countries, and economic growth.The urban population in developing countries has increasedby 326 per cent since 1970. This rapid growth has for the mostpart been unplanned and poorly governed, leading to highexposure and vulnerability. Middle-income countries bearthe brunt of the phenomenon.People in low-income countries are more vulnerable still,but relatively fewer people are exposed to hazards. That said,population projections suggest that exposure will increase inmany low-income countries over the coming decades.The relatively low vulnerability of high-income countries doesnot mean that they are not affected. Around 1.8 million peoplewere displaced in high-income countries in 2014, and this isexplained by three factors:» All countries are vulnerable to the most extreme hazards» Inequality within high-income countries makes displacementa particular concern for people less well off and thosesubject to discrimination and marginalisation» Effective early warning systems and disaster responsessave lives, but increase displacement among survivors as aprotective measureGeographical distribution and the biggest eventsDisplacement by region and countryAsia is home to 60 per cent of the world’s population, but accountedfor 87 per cent of the people displaced by disastersworldwide in 2014. 16.7 million people were forced to flee theirhomes in the region.8 Global <strong>Estimates</strong> 2015
Modelled global displacement trend for 1970 to 2014(per million inhabitants)The scale of global displacement by disasters, 2008-2014People displaced per million inhabitants6,0005,0004,0003,0002,0001,000Modelled trendPeople displaced (millions)504030201036.516.742.4Related to weather hazardsRelated to geophysical hazards32.4Average, 26.4m22.319.315.001970 1980 1990Source: IDMC data as of 1 June 2015200020082014IDMCannual data02008 2009 2010 2011 2012Note: Figures are rounded to the nearest decimal point.20132014» Eleven of the 20 countries worst affected by displacementover the last seven years are in Asia.Europe experienced double its average level of displacementfor the past seven years in 2014, with 190,000 people displaced,most of them by flooding in the Balkans.Displacement in Africa was three times lower than averagein 2014 in absolute terms, but many African countries experiencedhigh levels relative to their population size.» The highest level of displacement in relative terms in 2014was in Sudan, where rainy season floods displaced 159,000people.In Chile, one of the largest displacements of the year highlightedthe benefit of investment in disaster prevention andpreparedness. Around 970,000 people fled low-lying coastalareas in response to an 8.2 magnitude offshore earthquakeand tsunami warning in April. Most people were able to returnhome the following day.Developing countries are consistently the worst affected,with almost 175 million people displaced since 2008, accountingfor 95 per cent of the global total. The figure for 2014 was17.4 million, or 91 per cent of the global total.The big three: China, India and the PhilippinesChina, India and the Philippines experienced the highest levelsof displacement in absolute terms, both in 2014 and for the2008 to 2014 period.Disasters related to floods, storms, earthquakes and volcaniceruptions in the three countries accounted for 15 of the 20largest displacements in 2014.Multiple and repeated displacements in the same parts ofthe three countries point to areas of particularly high exposureand vulnerability.The Philippines was among the three worst-affected countriesin relative and absolute terms, both in 2014 and over the 2008to 2014 period.Large-scale evacuations prompted by two category-threetyphoons in the Philippines caused the largest displacementsworldwide for the second year running in 2014.Small but significant: impacts on small island developingstates (SIDS)Their populations are relatively small, but SIDS are disproportionatelyaffected by displacement associated with floods,storms and earthquakes.Between 2008 and 2014, they experienced levels three timeshigher than the global average, relative to their populationsizes.Twelve per cent of the countries where we recorded displacementrelated to disasters in 2014 were SIDS, of which five wereamong the 20 worst-affected countries worldwide in relativeterms.Cyclone Ian in Tonga caused the second largest displacementworldwide in relative terms in 2014. Only 5,300 people wereforced to flee their homes, but they accounted for five per centof the island’s population.Haiti and Cuba have had the highest levels of displacementamong SIDS over the past seven years in both relative andabsolute terms, caused by earthquakes, floods and storms.Multiple hazards in fragile and conflict-affected statesA complex mix of overlapping hazards contribute to displacementand determine patterns of movement and needs in fragileand conflict-affected countries. This makes an integratedanalysis particularly important as the basis for policymakingand planning.People displaced by disasters9
- Page 1: Global Estimates 2015People displac
- Page 4 and 5: IDMC core project teamCoordinator/l
- Page 7 and 8: 5. Mind your assumptions: Protracte
- Page 9: FIGURES, TABLES AND MAPSFigure 2.1:
- Page 13 and 14: 1INTRODUCTIONSince 2008, an average
- Page 15 and 16: 2CONCEPTUALISINGDISPLACEMENTin the
- Page 17 and 18: Box 2.1: Slow-onset hazards and gra
- Page 19 and 20: Repeated and frequent displacementR
- Page 21 and 22: 3THE GLOBAL PICTUREScale, patterns
- Page 23 and 24: Figure 3.2: Global displacement by
- Page 25 and 26: Box 3.1: “Super” El Niño and d
- Page 27 and 28: While more resilient families may b
- Page 30 and 31: 28 Global Estimates 2015A woman sta
- Page 32 and 33: 4.1 RegionsAs in previous years, As
- Page 34 and 35: 4.2 CountriesThe number of people d
- Page 36 and 37: forward, the municipalities of Pasc
- Page 38 and 39: 4.4 The big three: China, India and
- Page 40 and 41: Map 4.1: Philippines regions affect
- Page 42 and 43: Displacement caused by seasonalfloo
- Page 44 and 45: 4.6 Multiple hazards in fragile and
- Page 46 and 47: SPOTLIGHTAFGHANISTANBlurred lines b
- Page 48 and 49: 46 Global Estimates 2015A displaced
- Page 50 and 51: The global data presented in this r
- Page 52 and 53: The international experts we interv
- Page 54 and 55: perstorm Sandy in 2009, and indigen
- Page 56 and 57: SPOTLIGHTPAPUA NEW GUINEAManam isla
- Page 58 and 59: SPOTLIGHTINDONESIASidoarjo mudflow
- Page 60 and 61:
SPOTLIGHTBANGLADESHSix years after
- Page 62 and 63:
Figure 5.4: Movement of IDPs from a
- Page 64 and 65:
SPOTLIGHTHAITIChronic vulnerability
- Page 66 and 67:
Conditions have continued to deteri
- Page 68 and 69:
Map 5.3: Ongoing displacement in th
- Page 70 and 71:
The mental and physical health ofID
- Page 72 and 73:
SPOTLIGHTUNITED STATESDisplaced peo
- Page 74:
assistance available and implementa
- Page 77 and 78:
6THE POST-2015GLOBAL POLICYAGENDAKe
- Page 79 and 80:
A landslide devastated villages in
- Page 81 and 82:
ANNEX AMethodologyIDMC’s annual G
- Page 83 and 84:
protracted displacement situations
- Page 85 and 86:
Data on housing rendereduninhabitab
- Page 87 and 88:
Modelling and calibration usingthe
- Page 89 and 90:
We also asked each interviewee toth
- Page 91 and 92:
RankingCountry Hazard Affected area
- Page 93 and 94:
* Text in parentheses indicates the
- Page 95 and 96:
Country DisasterStartdateTotal no.
- Page 98 and 99:
Country DisasterStartdateTotal no.
- Page 100 and 101:
Country DisasterStartdateTotal no.
- Page 102 and 103:
REFERENCESSection 21. UNISDR, Termi
- Page 104 and 105:
34. NDRRMC, SitRep No.27 re Effects
- Page 106 and 107:
nation Group, October 2009, availab
- Page 108:
digidepo_8841940_po_076709.pdf?cont