Estimates
bzTPL9
bzTPL9
- No tags were found...
Create successful ePaper yourself
Turn your PDF publications into a flip-book with our unique Google optimized e-Paper software.
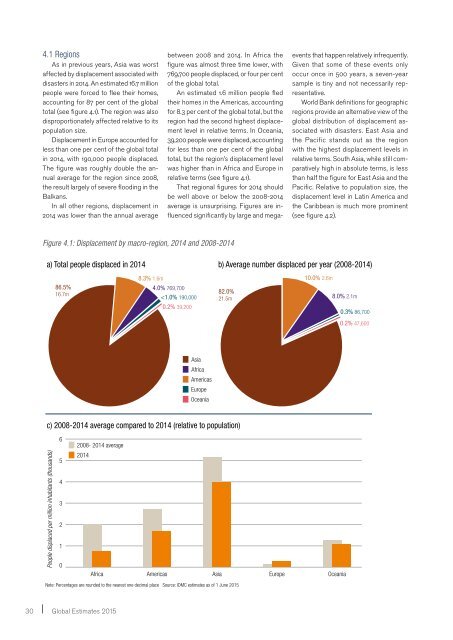
4.1 RegionsAs in previous years, Asia was worstaffected by displacement associated withdisasters in 2014. An estimated 16.7 millionpeople were forced to flee their homes,accounting for 87 per cent of the globaltotal (see figure 4.1). The region was alsodisproportionately affected relative to itspopulation size.Displacement in Europe accounted forless than one per cent of the global totalin 2014, with 190,000 people displaced.The figure was roughly double the annualaverage for the region since 2008,the result largely of severe flooding in theBalkans.In all other regions, displacement in2014 was lower than the annual averagebetween 2008 and 2014. In Africa thefigure was almost three time lower, with769,700 people displaced, or four per centof the global total.An estimated 1.6 million people fledtheir homes in the Americas, accountingfor 8.3 per cent of the global total, but theregion had the second highest displacementlevel in relative terms. In Oceania,39,200 people were displaced, accountingfor less than one per cent of the globaltotal, but the region’s displacement levelwas higher than in Africa and Europe inrelative terms (see figure 4.1).That regional figures for 2014 shouldbe well above or below the 2008-2014average is unsurprising. Figures are influencedsignificantly by large and megaeventsthat happen relatively infrequently.Given that some of these events onlyoccur once in 500 years, a seven-yearsample is tiny and not necessarily representative.World Bank definitions for geographicregions provide an alternative view of theglobal distribution of displacement associatedwith disasters. East Asia andthe Pacific stands out as the regionwith the highest displacement levels inrelative terms. South Asia, while still comparativelyhigh in absolute terms, is lessthan half the figure for East Asia and thePacific. Relative to population size, thedisplacement level in Latin America andthe Caribbean is much more prominent(see figure 4.2).Figure 4.1: Displacement by macro-region, 2014 and 2008-2014a) Total people displaced in 2014b) Average number displaced per year (2008-2014)86.5%16.7m8.3% 1.6m 10.0% 2.6m4.0% 769,700


