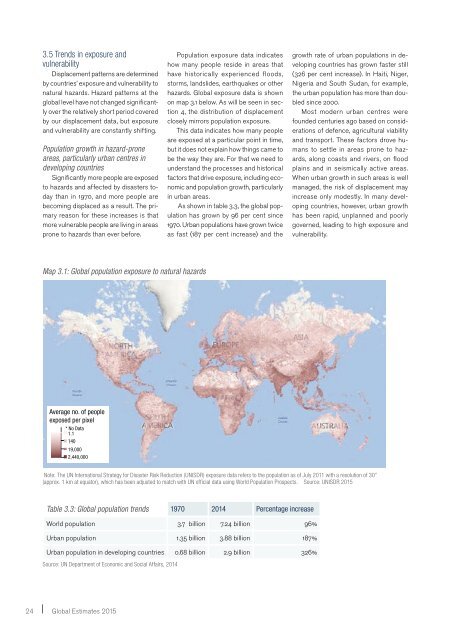
3.5 Trends in exposure andvulnerabilityDisplacement patterns are determinedby countries’ exposure and vulnerability tonatural hazards. Hazard patterns at theglobal level have not changed significantlyover the relatively short period coveredby our displacement data, but exposureand vulnerability are constantly shifting.Population growth in hazard-proneareas, particularly urban centres indeveloping countriesSignificantly more people are exposedto hazards and affected by disasters todaythan in 1970, and more people arebecoming displaced as a result. The primaryreason for these increases is thatmore vulnerable people are living in areasprone to hazards than ever before.Population exposure data indicateshow many people reside in areas thathave historically experienced floods,storms, landslides, earthquakes or otherhazards. Global exposure data is shownon map 3.1 below. As will be seen in section4, the distribution of displacementclosely mirrors population exposure.This data indicates how many peopleare exposed at a particular point in time,but it does not explain how things came tobe the way they are. For that we need tounderstand the processes and historicalfactors that drive exposure, including economicand population growth, particularlyin urban areas.As shown in table 3.3, the global populationhas grown by 96 per cent since1970. Urban populations have grown twiceas fast (187 per cent increase) and thegrowth rate of urban populations in developingcountries has grown faster still(326 per cent increase). In Haiti, Niger,Nigeria and South Sudan, for example,the urban population has more than doubledsince 2000.Most modern urban centres werefounded centuries ago based on considerationsof defence, agricultural viabilityand transport. These factors drove humansto settle in areas prone to hazards,along coasts and rivers, on floodplains and in seismically active areas.When urban growth in such areas is wellmanaged, the risk of displacement mayincrease only modestly. In many developingcountries, however, urban growthhas been rapid, unplanned and poorlygoverned, leading to high exposure andvulnerability.Map 3.1: Global population exposure to natural hazardsAverage no. of peopleexposed per pixel* No Data1.114019,0002,440,000Note: The UN International Strategy for Disaster Risk Reduction (UNISDR) exposure data refers to the population as of July 2011 with a resolution of 30”(approx. 1 km at equator), which has been adjusted to match with UN official data using World Population Prospects. Source: UNISDR 2015Table 3.3: Global population trends 1970 2014 Percentage increaseWorld population 3.7 billion 7.24 billion 96%Urban population 1.35 billion 3.88 billion 187%Urban population in developing countries 0.68 billion 2.9 billion 326%Source: UN Department of Economic and Social Affairs, 201424 Global <strong>Estimates</strong> 2015
While more resilient families may beable to manage their exposure to less intensehazards such as seasonal floods orsmall earthquakes, these events can be asignificant burden for the poorest familieswho have few resources to prepare forand recover from them and prevent theirrecurrence. For example, large numbersof people in the Philippines, India, Nigeriaand other countries live in coastal orriverine floodplains.Settlement in these areas is due to theirclose proximity to livelihood opportunitiesand the lack of available land in safer areas.In this precarious situation, they areexposed and vulnerable to frequent floodingand, due to the lack of viable alternatives,often choose to return to the samearea after having been displaced duringa disaster. Their situation becomes evenmore acute when displacement is repeatedand frequent, potentially trapping them in acycle of chronic poverty and disaster risk. 19Economic growthDeveloping countries accounted for91 per cent of global displacement in 2014and 95 per cent over the seven-year period(see figure 3.5). Among developingcountries, the link between economicdevelopment and displacement is underscoredby the fact that most displacementoccurs in middle-income rather than lowincomecountries. Lower middle-incomecountries make up 36 per cent of theworld’s population, but accounted for 61per cent of displacement in 2014 and 46.8per cent between 2008 and 2014. Lowincomecountries were also significantlyaffected, with around 1.4 million peopledisplaced in 2014 and 16.7 million peoplebetween 2008 and 2014 (see figure 3.5).Figure 3.6 shows that displacementlevels between 2008-2014 have been particularlyhigh in middle-income countriesin east Asia and the Pacific and southAsia. A similar pattern emerges when itis viewed relative to countries’ HDI rankings.Most displacement takes place incountries in the third and fourth quintiles,and comparatively little in those with thehighest and lowest levels of human development(see figure 3.7).Exposure has increased more quicklythan vulnerability has been reduced. Theurban population boom in middle-incomecountries means that rapidly increasingnumbers of people are exposed to hazards,and many of them remain vulnerable.A roughly equal number of peoplein Japan and the Philippines are exposedto typhoons, for example. However, as thisreport has shown, the Philippines experiencesmuch higher levels of displacementbecause its exposed population is morevulnerable to this hazard.Figure 3.5: Global displacement and population by World Bank income groupDISPLACEMENT2008-2014 201446.8%86.3m39%72.0m61%11.7m22.3%4.3mPOPULATION36%2.5b34%2.4b18%1.2bPeople in low-income countries aremore vulnerable still and relatively lessexposed. They account for less of theglobal population and have not yet seenthe rates of growth of middle-incomecountries. That said, population projectionssuggest that exposure will increasein many low-income countries over thecoming decades, particularly in Africa.Japan and high-income countriesin Europe and North America all havelarge populations exposed to hazardsbut relatively low levels of displacement.Nevertheless, some high-income countrieshave significant absolute levels ofdisplacement, with 1.8 million people displacedin 2014 (see figure 3.5).There are several reasons that high-incomecountries experience displacement.First, low vulnerability does not meanthat these countries are not affected byhazards - particularly large ones such asmajor tsunamis, category 5 cyclones andsevere earthquakes.Inequality within high-income countriesalso makes displacement a particularconcern for people less well off andthose subject to discrimination and marginalisation.Examples include people stilldisplaced in the US following superstormSandy in 2009 and others still displacedsince 2011 by the flood disaster in Canada(see section five on protracted displacementsituations).Lastly, in high-income countries, effectivelive-saving early warning systemsand disaster response result in fewer disasterfatalities but increase the numberof survivors who are displaced as a consequence.The case of Chile’s responseto the Iquique earthquake and tsunamiwarning in 2014 is a case in point, as furtherdiscussed in section four).5.2% 9.5m9% 16.7m9.4% 1.8m7.3% 1.4m12% 0.8bDeveloping countriesUpper middle incomeLower middle incomeLow incomeHigh income countriesNote: Figures are rounded to the nearest decimal pointSource: IDMC data as of 1 June 20153 | The global picture: scales, patterns and trends25
- Page 1: Global Estimates 2015People displac
- Page 4 and 5: IDMC core project teamCoordinator/l
- Page 7 and 8: 5. Mind your assumptions: Protracte
- Page 9 and 10: FIGURES, TABLES AND MAPSFigure 2.1:
- Page 11 and 12: Modelled global displacement trend
- Page 13 and 14: 1INTRODUCTIONSince 2008, an average
- Page 15 and 16: 2CONCEPTUALISINGDISPLACEMENTin the
- Page 17 and 18: Box 2.1: Slow-onset hazards and gra
- Page 19 and 20: Repeated and frequent displacementR
- Page 21 and 22: 3THE GLOBAL PICTUREScale, patterns
- Page 23 and 24: Figure 3.2: Global displacement by
- Page 25: Box 3.1: “Super” El Niño and d
- Page 30 and 31: 28 Global Estimates 2015A woman sta
- Page 32 and 33: 4.1 RegionsAs in previous years, As
- Page 34 and 35: 4.2 CountriesThe number of people d
- Page 36 and 37: forward, the municipalities of Pasc
- Page 38 and 39: 4.4 The big three: China, India and
- Page 40 and 41: Map 4.1: Philippines regions affect
- Page 42 and 43: Displacement caused by seasonalfloo
- Page 44 and 45: 4.6 Multiple hazards in fragile and
- Page 46 and 47: SPOTLIGHTAFGHANISTANBlurred lines b
- Page 48 and 49: 46 Global Estimates 2015A displaced
- Page 50 and 51: The global data presented in this r
- Page 52 and 53: The international experts we interv
- Page 54 and 55: perstorm Sandy in 2009, and indigen
- Page 56 and 57: SPOTLIGHTPAPUA NEW GUINEAManam isla
- Page 58 and 59: SPOTLIGHTINDONESIASidoarjo mudflow
- Page 60 and 61: SPOTLIGHTBANGLADESHSix years after
- Page 62 and 63: Figure 5.4: Movement of IDPs from a
- Page 64 and 65: SPOTLIGHTHAITIChronic vulnerability
- Page 66 and 67: Conditions have continued to deteri
- Page 68 and 69: Map 5.3: Ongoing displacement in th
- Page 70 and 71: The mental and physical health ofID
- Page 72 and 73: SPOTLIGHTUNITED STATESDisplaced peo
- Page 74: assistance available and implementa
- Page 77 and 78:
6THE POST-2015GLOBAL POLICYAGENDAKe
- Page 79 and 80:
A landslide devastated villages in
- Page 81 and 82:
ANNEX AMethodologyIDMC’s annual G
- Page 83 and 84:
protracted displacement situations
- Page 85 and 86:
Data on housing rendereduninhabitab
- Page 87 and 88:
Modelling and calibration usingthe
- Page 89 and 90:
We also asked each interviewee toth
- Page 91 and 92:
RankingCountry Hazard Affected area
- Page 93 and 94:
* Text in parentheses indicates the
- Page 95 and 96:
Country DisasterStartdateTotal no.
- Page 98 and 99:
Country DisasterStartdateTotal no.
- Page 100 and 101:
Country DisasterStartdateTotal no.
- Page 102 and 103:
REFERENCESSection 21. UNISDR, Termi
- Page 104 and 105:
34. NDRRMC, SitRep No.27 re Effects
- Page 106 and 107:
nation Group, October 2009, availab
- Page 108:
digidepo_8841940_po_076709.pdf?cont