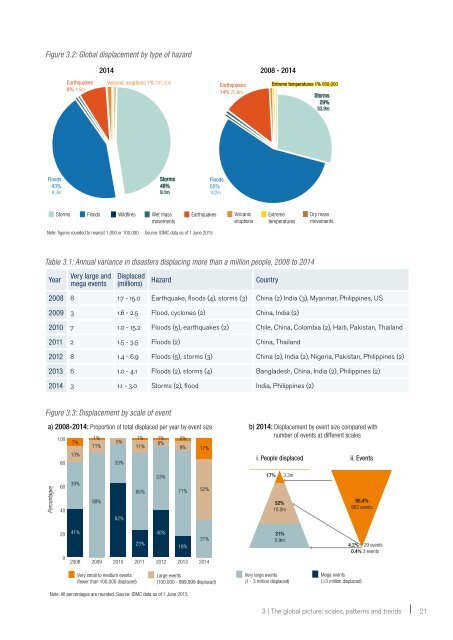
Figure 3.1: The global scale of displacement caused by disasters, 2008 to 2014People displaced (millions)50403020100WeatherGeophysical36.5m57%20.8m43%15.8m200816.7m91%15.3m42.4m90%38.3m15.0m92%13.9m32.4m98%31.7m22.3m92%20.4m9% 1.5m 10% 4.0m 8% 1.1m 2% 0.7m 8% 1.8m2009 2010 2011 2012 2013Average, 26.4m19.3m91%17.5m9% 1.7m2014Note: Differences in totals are due to rounding of figures to the nearest decimal point. Source: IDMC data as of 1 June 2015People displaced (millions)200150100500184.6m86%157.8m14%26.7m7 years3.1 The latest estimatesDisasters brought on by weatherrelatedand geophysical hazards forcedmore than 19.3 million people to leavetheir homes in 2014 (see figure 3.1). Thisestimate is based on 695 new displacementevents in 100 countries (see globalmap on the inside cover).Since 2008, an average of 26.4 millionpeople have been displaced by disasterseach year - equivalent to one person displacedevery second.3.2 Displacement by type ofhazardIn 2014, disasters associated withweather hazards, mostly floods andstorms, displaced more than 17.5 millionpeople, or 92 per cent of the global total.Storms were responsible for a higherthan average share of total displacement(see figure 3.2). The Atlantic hurricaneseason was relatively quiet, but the Pacificproduced the highest ever numberof storms ranked category four or higher,and equalled the modern record for thenumber of storms overall in a single season.1Most of the largest displacementsin 2014 were associated with weatherrelatedhazards. The three largest werecaused by typhoons and floods in thePhilippines and India (see table 3.1). Eightof the 20 largest disasters of the yearwere triggered by typhoons or tropicalstorms in Asia (see figure 4.4).Since 2008, an average of 22.5 millionpeople have been displaced by climate- orweather-related disasters. This is equivalentto 62,000 people every day.Climate change, on top of increasingexposure and vulnerability, is expected toexacerbate this trend further as the intensityand frequency of extreme weatherhazards increases in coming decades. 2Disasters related to geophysical hazards,primarily earthquakes and volcaniceruptions, displaced more than 1.7 millionpeople, or nine per cent of the 2014 total(see figure 3.2). Between 2008 and 2014,only three of the 37 disasters to displacemore than a million people were related togeophysical hazards - the 2008 Sichuanearthquake in China and the 2010 earthquakesin Haiti and Chile.3.3 Variance from year to yearAs can be seen in table 3.1, the totalnumber of people displaced varies greatlyfrom year to year, depending on the frequencyand size of the largest disasters.In 2014, 32 disasters displaced morethan 100,000 people, of which three displacedmore than a million. Together,those 32 accounted for 83 per cent of thetotal (see figure 3.3.b). This pattern wassimilar over the last seven-year period. In2008-2014, 34 disasters that displacedmore than a million people were responsiblefor two-thirds of the total (see table 3.1and figure 3.3.a). Such large-scale eventswere less frequent and relatively smallerin 2014, making the total for the year lowerthan the average of 26.4 million over theseven-year period.Displacements of fewer than 100,000people made up 95.4 per cent of theevents recorded in 2014, but only 17 percent of the total number displaced (seefigure 3.3b). A third of all events were verysmall, displacing fewer than 100 peopleeach, and their contribution to the globaltotal was negligible. At the same time, itshould be noted that small events tend tobe poorly reported in most countries andtheir true number is probably much higher.20 Global <strong>Estimates</strong> 2015
Figure 3.2: Global displacement by type of hazard2014 2008 - 2014Earthquakes8% 1.5mVolcanic eruptions 1% 245,000Earthquakes14% 25.8mExtreme temperatures 1% 958,000Storms29%53.9mFloods43%8.3mStorms48%9.1mFloods55%102mStorms Floods Wildfires Wet mass EarthquakesmovementsVolcaniceruptionsExtremetemperaturesDry massmovementsNote: figures rounded to nearest 1,000 or 100,000 Source: IDMC data as of 1 June 2015Table 3.1: Annual variance in disasters displacing more than a million people, 2008 to 2014YearVery large andmega eventsDisplaced(millions)HazardCountry2008 8 1.7 - 15.0 Earthquake, floods (4), storms (3) China (2) India (3), Myanmar, Philippines, US2009 3 1.6 - 2.5 Flood, cyclones (2) China, India (2)2010 7 1.0 - 15.2 Floods (5), earthquakes (2) Chile, China, Colombia (2), Haiti, Pakistan, Thailand2011 2 1.5 - 3.5 Floods (2) China, Thailand2012 8 1.4 - 6.9 Floods (5), storms (3) China (2), India (2), Nigeria, Pakistan, Philippines (2)2013 6 1.0 - 4.1 Floods (2), storms (4) Bangladesh, China, India (2), Philippines (2)2014 3 1.1 - 3.0 Storms (2), flood India, Philippines (2)Figure 3.3: Displacement by scale of eventa) 2008-2014: Proportion of total displaced per year by event size100807%13%1%11%5%33%1%11%1%6%2%9%17%b) 2014: Displacement by event size compared withnumber of events at different scalesi. People displacedii. EventsPercentages604039%88%62%65%53%71%52%17% 3.3m52%10.0m95.4%663 events20041%20082009201023%201140%201218%201331%201431%5.9m4.2% 29 events0.4% 3 eventsVery small to medium events(fewer than 100,000 displaced)Large events(100,000 - 999,999 displaced)Very large events(1 - 3 million displaced)Mega events(>3 million displaced)Note: All percentages are rounded. Source: IDMC data as of 1 June 20153 | The global picture: scales, patterns and trends21
- Page 1: Global Estimates 2015People displac
- Page 4 and 5: IDMC core project teamCoordinator/l
- Page 7 and 8: 5. Mind your assumptions: Protracte
- Page 9 and 10: FIGURES, TABLES AND MAPSFigure 2.1:
- Page 11 and 12: Modelled global displacement trend
- Page 13 and 14: 1INTRODUCTIONSince 2008, an average
- Page 15 and 16: 2CONCEPTUALISINGDISPLACEMENTin the
- Page 17 and 18: Box 2.1: Slow-onset hazards and gra
- Page 19 and 20: Repeated and frequent displacementR
- Page 21: 3THE GLOBAL PICTUREScale, patterns
- Page 25 and 26: Box 3.1: “Super” El Niño and d
- Page 27 and 28: While more resilient families may b
- Page 30 and 31: 28 Global Estimates 2015A woman sta
- Page 32 and 33: 4.1 RegionsAs in previous years, As
- Page 34 and 35: 4.2 CountriesThe number of people d
- Page 36 and 37: forward, the municipalities of Pasc
- Page 38 and 39: 4.4 The big three: China, India and
- Page 40 and 41: Map 4.1: Philippines regions affect
- Page 42 and 43: Displacement caused by seasonalfloo
- Page 44 and 45: 4.6 Multiple hazards in fragile and
- Page 46 and 47: SPOTLIGHTAFGHANISTANBlurred lines b
- Page 48 and 49: 46 Global Estimates 2015A displaced
- Page 50 and 51: The global data presented in this r
- Page 52 and 53: The international experts we interv
- Page 54 and 55: perstorm Sandy in 2009, and indigen
- Page 56 and 57: SPOTLIGHTPAPUA NEW GUINEAManam isla
- Page 58 and 59: SPOTLIGHTINDONESIASidoarjo mudflow
- Page 60 and 61: SPOTLIGHTBANGLADESHSix years after
- Page 62 and 63: Figure 5.4: Movement of IDPs from a
- Page 64 and 65: SPOTLIGHTHAITIChronic vulnerability
- Page 66 and 67: Conditions have continued to deteri
- Page 68 and 69: Map 5.3: Ongoing displacement in th
- Page 70 and 71: The mental and physical health ofID
- Page 72 and 73:
SPOTLIGHTUNITED STATESDisplaced peo
- Page 74:
assistance available and implementa
- Page 77 and 78:
6THE POST-2015GLOBAL POLICYAGENDAKe
- Page 79 and 80:
A landslide devastated villages in
- Page 81 and 82:
ANNEX AMethodologyIDMC’s annual G
- Page 83 and 84:
protracted displacement situations
- Page 85 and 86:
Data on housing rendereduninhabitab
- Page 87 and 88:
Modelling and calibration usingthe
- Page 89 and 90:
We also asked each interviewee toth
- Page 91 and 92:
RankingCountry Hazard Affected area
- Page 93 and 94:
* Text in parentheses indicates the
- Page 95 and 96:
Country DisasterStartdateTotal no.
- Page 98 and 99:
Country DisasterStartdateTotal no.
- Page 100 and 101:
Country DisasterStartdateTotal no.
- Page 102 and 103:
REFERENCESSection 21. UNISDR, Termi
- Page 104 and 105:
34. NDRRMC, SitRep No.27 re Effects
- Page 106 and 107:
nation Group, October 2009, availab
- Page 108:
digidepo_8841940_po_076709.pdf?cont