

Estimates
bzTPL9
bzTPL9
- No tags were found...

Create successful ePaper yourself
Turn your PDF publications into a flip-book with our unique Google optimized e-Paper software.
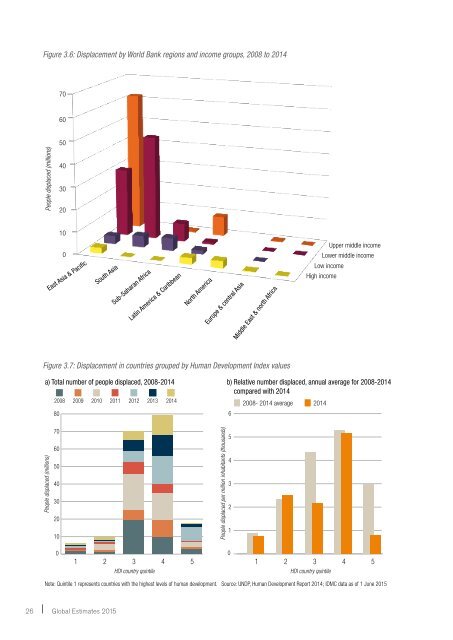
Figure 3.6: Displacement by World Bank regions and income groups, 2008 to 20147060People displaced (millions)50403020100East Asia & PacificSouth AsiaSub-Saharan AfricaLatin America & CaribbeanNorth AmericaEurope & central AsiaMiddle East & north AfricaUpper middle incomeLower middle incomeLow incomeHigh incomeFigure 3.7: Displacement in countries grouped by Human Development Index valuesa) Total number of people displaced, 2008-2014 b) Relative number displaced, annual average for 2008-2014compared with 20142008 2009 2010 2011 2012 2013 20142008- 2014 average 2014806People displaced (millions)70605040302010People displaced per million inhabitants (thousands)54321001 2 3 4 51 2 3 4 5HDI country quintileHDI country quintileNote: Quintile 1 represents countries with the highest levels of human development. Source: UNDP, Human Development Report 2014; IDMC data as of 1 June 201526 Global <strong>Estimates</strong> 2015