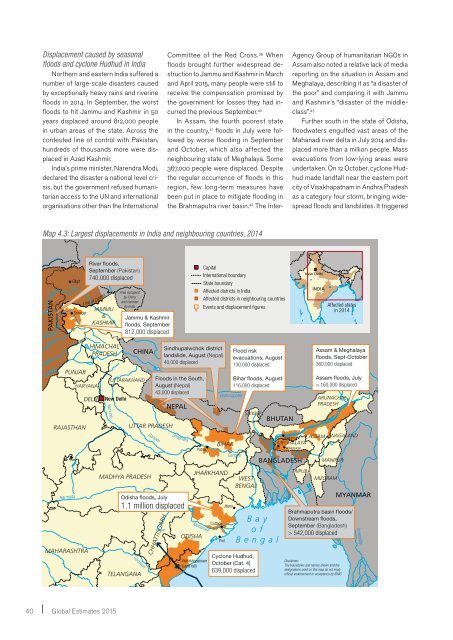
Displacement caused by seasonalfloods and cyclone Hudhud in IndiaNorthern and eastern India suffered anumber of large-scale disasters causedby exceptionally heavy rains and riverinefloods in 2014. In September, the worstfloods to hit Jammu and Kashmir in 50years displaced around 812,000 peoplein urban areas of the state. Across thecontested line of control with Pakistan,hundreds of thousands more were displacedin Azad Kashmir.India’s prime minister, Narendra Modi,declared the disaster a national level crisis,but the government refused humanitarianaccess to the UN and internationalorganisations other than the InternationalCommittee of the Red Cross. 39 Whenfloods brought further widespread destructionto Jammu and Kashmir in Marchand April 2015, many people were still toreceive the compensation promised bythe government for losses they had incurredthe previous September. 40In Assam, the fourth poorest statein the country, 41 floods in July were followedby worse flooding in Septemberand October, which also affected theneighbouring state of Meghalaya. Some367,000 people were displaced. Despitethe regular occurrence of floods in thisregion, few long-term measures havebeen put in place to mitigate flooding inthe Brahmaputra river basin. 42 The Inter-Agency Group of humanitarian NGOs inAssam also noted a relative lack of mediareporting on the situation in Assam andMeghalaya, describing it as “a disaster ofthe poor” and comparing it with Jammuand Kashmir’s “disaster of the middleclass”.43Further south in the state of Odisha,floodwaters engulfed vast areas of theMahanadi river delta in July 2014 and displacedmore than a million people. Massevacuations from low-lying areas wereundertaken. On 12 October, cyclone Hudhudmade landfall near the eastern portcity of Visakhapatnam in Andhra Pradeshas a category four storm, bringing widespreadfloods and landslides. It triggeredMap 4.3: Largest displacements in India and neighbouring countries, 2014IndusPAKISTANJhelumChenabRaviSutlejNarmadaGilgitLSrinagarPUNJABRAJASTHANine of ControlHARYANAMAHARASHTRARiver floods,September (Pakistan)740,000 displacedJAMMU&KASHMIRHIMACHALPRADESHDELHINew DelhiYamunaArea occupiedby Chinaand claimedby IndiaJammu & Kashmirfloods, September812,000 displacedUTTARAKHANDUTTAR PRADESHMADHYA PRADESHGodavariTELANGANACHINAGangesFloods in the South,August (Nepal)43,000 displacedCHHATTISGARHNEPALGhagharaOdisha floods, July1.1 million displacedPatnaMahanadiODISHAVishakhapatnam(Land fall)CapitalInternational boundarySindhupalwchok districtlandslide, August (Nepal)40,000 displacedState boundaryAffected districts in IndiaAffected districts in neighbouring countriesEvents and displacement figuresBrahmaputraBIHARJHARKHANDCuttackPuriGangesJaipurFlood riskevacuations, August130,000 displacedBihar floods, August116,000 displacedSIKKIMWESTBENGALCyclone Hudhud,October (Cat. 4)639,000 displacedBayofBengalBHUTANGoalpara ASSAMMEGHALAYATuraWilliamnagarBANGLADESHTRIPURANew DelhiINDIAAssam & Meghalayafloods, Sept-October360,000 displacedAssam floods, July> 160,000 displacedARUNACHALPRADESHDisclaimer:The boundaries and names shown and thedesignations used on this map do not implyofficial endorsement or acceptance by IDMC.NAGALANDMANIPURMIZORAMAffected statesin 2014Brahmaputra basin floods/Downstream floods,September (Bangladesh)> 542,000 displacedMYANMARIrrawaddyKrishna40 Global <strong>Estimates</strong> 2015
one of the most costly disasters of theyear, causing losses of around $11 billion.Learning from experiences aheadof cyclone Phailin almost exactly a yearearlier, the Andhra Pradesh and Odishastate authorities increased their effortsto convince residents of coastal and hillcommunities that they should evacuatefor their own safety ahead of Hudhud. 44For thousands of people from the hilltribes, this was their first time to everleave their home areas. 45 The evacuationof around 600,000 people can be creditedwith helping to minimise fatalities. Whena huge storm hit the area 15 years earlier,10,000 people were killed. 45 State officialsput the death toll from Hudhud at 41 (seemap 4.3). 464.5 Small but significant: Impactson small island developing statesSIDS are usually among the worstaffected countries each year in relativeterms because of their size, location andtopography. Their mostly low-lying islandpopulations tend to be exposed to a rangeof hazards, particularly cyclones, floods,landslides, earthquakes and tsunamis,and when a disaster occurs it can affecta large part of the country.Over the last seven years, SIDS haveexperienced relative levels of displacementat around three times the averagefor all countries combined (see figure4.8.a). Haiti and Cuba have had the highestlevels of displacement among SIDSin both relative and absolute terms (seefigure 4.8.b).This pattern is also repeated in termsof the largest events of 2014 in relativeterms. Four out of the 10 largest eventstook place in SIDS, including disastersin the Pacific triggered by cyclone Ian inTonga, king tides in the Marshall Islands,floods in the Solomon Islands, and inthe Comoros Islands off the east coastof Africa also brought on by floods (seefigure 4.4.b).Cyclone Ian, a category five storm, becamethe most powerful ever to hit Tongaand caused the second largest displacementof the year relative to populationsize. An estimated 5,300 people wereforced to flee their homes, representingaround five per cent of the island’spopulation. 48 The government declared astate of emergency in Ha’apai and Vava’uon the day it made landfall. The Ha’apaiisland group suffered devastation acrossall sectors. Eighty per cent of its housingand many public facilities were damagedor destroyed. 49 Around 4,000 peopletook refuge in evacuation centres, mostof them set up in churches. 50Two months after the storm, 300 familiesin Ha’apai were still living in tents. 51Those in greatest need of housing assistance,as identified by the governmentand community, included households witholder members and members who havedisabilities, those with single or widowedparents, as well as large families andthose with little access to remittances.Reconstruction is underway, but 14months after Ian struck, more than 300people were still waiting for their homesto be rebuilt (see annex C). 52Figure 4.8: Displacement in SIDS relative to population size, 2008 to 2014 (per million inhabitants)a) SIDS compared with all other countries b) SIDS with the highest displacement levels0 500000 1000000 1500000 2000000People displaced per million inhabitants (thousands)30252015105All othersSIDSHaitiCubaPalauSamoaFijiTongaSolomon IslandsMarshall IslandsCook IslandsComorosPapua New GuineaAbsolute scaleRelative scale02008 2009 2010 20112012 20132014Saint Vincent &the Grenadines0 50000 100000 150000 200000Source: IDMC data as of 1 June 20154 | Geographical distribution and the biggest events41
- Page 1: Global Estimates 2015People displac
- Page 4 and 5: IDMC core project teamCoordinator/l
- Page 7 and 8: 5. Mind your assumptions: Protracte
- Page 9 and 10: FIGURES, TABLES AND MAPSFigure 2.1:
- Page 11 and 12: Modelled global displacement trend
- Page 13 and 14: 1INTRODUCTIONSince 2008, an average
- Page 15 and 16: 2CONCEPTUALISINGDISPLACEMENTin the
- Page 17 and 18: Box 2.1: Slow-onset hazards and gra
- Page 19 and 20: Repeated and frequent displacementR
- Page 21 and 22: 3THE GLOBAL PICTUREScale, patterns
- Page 23 and 24: Figure 3.2: Global displacement by
- Page 25 and 26: Box 3.1: “Super” El Niño and d
- Page 27 and 28: While more resilient families may b
- Page 30 and 31: 28 Global Estimates 2015A woman sta
- Page 32 and 33: 4.1 RegionsAs in previous years, As
- Page 34 and 35: 4.2 CountriesThe number of people d
- Page 36 and 37: forward, the municipalities of Pasc
- Page 38 and 39: 4.4 The big three: China, India and
- Page 40 and 41: Map 4.1: Philippines regions affect
- Page 44 and 45: 4.6 Multiple hazards in fragile and
- Page 46 and 47: SPOTLIGHTAFGHANISTANBlurred lines b
- Page 48 and 49: 46 Global Estimates 2015A displaced
- Page 50 and 51: The global data presented in this r
- Page 52 and 53: The international experts we interv
- Page 54 and 55: perstorm Sandy in 2009, and indigen
- Page 56 and 57: SPOTLIGHTPAPUA NEW GUINEAManam isla
- Page 58 and 59: SPOTLIGHTINDONESIASidoarjo mudflow
- Page 60 and 61: SPOTLIGHTBANGLADESHSix years after
- Page 62 and 63: Figure 5.4: Movement of IDPs from a
- Page 64 and 65: SPOTLIGHTHAITIChronic vulnerability
- Page 66 and 67: Conditions have continued to deteri
- Page 68 and 69: Map 5.3: Ongoing displacement in th
- Page 70 and 71: The mental and physical health ofID
- Page 72 and 73: SPOTLIGHTUNITED STATESDisplaced peo
- Page 74: assistance available and implementa
- Page 77 and 78: 6THE POST-2015GLOBAL POLICYAGENDAKe
- Page 79 and 80: A landslide devastated villages in
- Page 81 and 82: ANNEX AMethodologyIDMC’s annual G
- Page 83 and 84: protracted displacement situations
- Page 85 and 86: Data on housing rendereduninhabitab
- Page 87 and 88: Modelling and calibration usingthe
- Page 89 and 90: We also asked each interviewee toth
- Page 91 and 92: RankingCountry Hazard Affected area
- Page 93 and 94:
* Text in parentheses indicates the
- Page 95 and 96:
Country DisasterStartdateTotal no.
- Page 98 and 99:
Country DisasterStartdateTotal no.
- Page 100 and 101:
Country DisasterStartdateTotal no.
- Page 102 and 103:
REFERENCESSection 21. UNISDR, Termi
- Page 104 and 105:
34. NDRRMC, SitRep No.27 re Effects
- Page 106 and 107:
nation Group, October 2009, availab
- Page 108:
digidepo_8841940_po_076709.pdf?cont