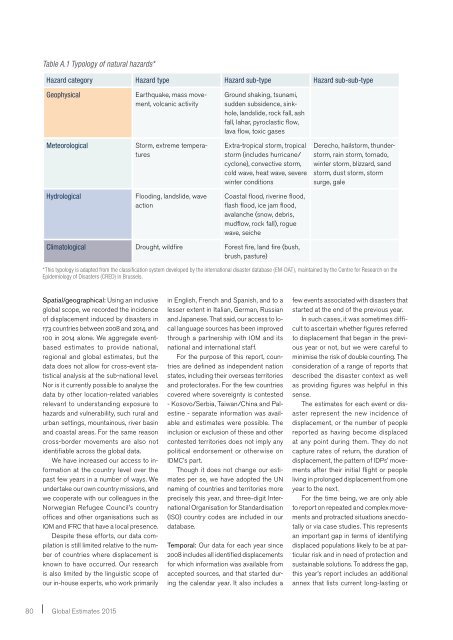
Table A.1 Typology of natural hazards*Hazard category Hazard type Hazard sub-type Hazard sub-sub-typeGeophysicalEarthquake, mass movement,volcanic activityGround shaking, tsunami,sudden subsidence, sinkhole,landslide, rock fall, ashfall, lahar, pyroclastic flow,lava flow, toxic gasesMeteorologicalStorm, extreme temperaturesExtra-tropical storm, tropicalstorm (includes hurricane/cyclone), convective storm,cold wave, heat wave, severewinter conditionsDerecho, hailstorm, thunderstorm,rain storm, tornado,winter storm, blizzard, sandstorm, dust storm, stormsurge, galeHydrologicalFlooding, landslide, waveactionCoastal flood, riverine flood,flash flood, ice jam flood,avalanche (snow, debris,mudflow, rock fall), roguewave, seicheClimatological Drought, wildfire Forest fire, land fire (bush,brush, pasture)*This typology is adapted from the classification system developed by the international disaster database (EM-DAT), maintained by the Centre for Research on theEpidemiology of Disasters (CRED) in Brussels.Spatial/geographical: Using an inclusiveglobal scope, we recorded the incidenceof displacement induced by disasters in173 countries between 2008 and 2014, and100 in 2014 alone. We aggregate eventbasedestimates to provide national,regional and global estimates, but thedata does not allow for cross-event statisticalanalysis at the sub-national level.Nor is it currently possible to analyse thedata by other location-related variablesrelevant to understanding exposure tohazards and vulnerability, such rural andurban settings, mountainous, river basinand coastal areas. For the same reasoncross-border movements are also notidentifiable across the global data.We have increased our access to informationat the country level over thepast few years in a number of ways. Weundertake our own country missions, andwe cooperate with our colleagues in theNorwegian Refugee Council’s countryoffices and other organisations such asIOM and IFRC that have a local presence.Despite these efforts, our data compilationis still limited relative to the numberof countries where displacement isknown to have occurred. Our researchis also limited by the linguistic scope ofour in-house experts, who work primarilyin English, French and Spanish, and to alesser extent in Italian, German, Russianand Japanese. That said, our access to locallanguage sources has been improvedthrough a partnership with IOM and itsnational and international staff.For the purpose of this report, countriesare defined as independent nationstates, including their overseas territoriesand protectorates. For the few countriescovered where sovereignty is contested- Kosovo/Serbia, Taiwan/China and Palestine- separate information was availableand estimates were possible. Theinclusion or exclusion of these and othercontested territories does not imply anypolitical endorsement or otherwise onIDMC’s part.Though it does not change our estimatesper se, we have adopted the UNnaming of countries and territories moreprecisely this year, and three-digit InternationalOrganisation for Standardisation(ISO) country codes are included in ourdatabase.Temporal: Our data for each year since2008 includes all identified displacementsfor which information was available fromaccepted sources, and that started duringthe calendar year. It also includes afew events associated with disasters thatstarted at the end of the previous year.In such cases, it was sometimes difficultto ascertain whether figures referredto displacement that began in the previousyear or not, but we were careful tominimise the risk of double counting. Theconsideration of a range of reports thatdescribed the disaster context as wellas providing figures was helpful in thissense.The estimates for each event or disasterrepresent the new incidence ofdisplacement, or the number of peoplereported as having become displacedat any point during them. They do notcapture rates of return, the duration ofdisplacement, the pattern of IDPs’ movementsafter their initial flight or peopleliving in prolonged displacement from oneyear to the next.For the time being, we are only ableto report on repeated and complex movementsand protracted situations anecdotallyor via case studies. This representsan important gap in terms of identifyingdisplaced populations likely to be at particularrisk and in need of protection andsustainable solutions. To address the gap,this year’s report includes an additionalannex that lists current long-lasting or80 Global <strong>Estimates</strong> 2015
protracted displacement situations as astarting point for further monitoring.Demographic: We collect our data inways that aim to be as inclusive as possibleof all displaced people and withoutbias towards particular countries, populationgroups or in terms of where IDPstake refuge.The displaced population in any givensituation is far from a homogenous group,but disaggregated data is relatively rare.Analysis using key metrics such as genderand age is only possible for specificsituations or segments of the overall displacedpopulation. Higher quality data isusually limited to IDPs living in collectivesites or settings, where they are assessedin more detail for operational purposes.The paucity of data on those dispersedoutside official camps and collective sitesis another important gap. Were such informationmore widely available, the statisticalanalysis of patterns and trendsin IDPs’ differentiated needs in diversecontexts would be possible, which wouldin turn enable the ability of governments,humanitarian and development organisationsand donors to determine whereassistance is most needed.For the purpose of providing comprehensiveestimates, we base the overallestimate for an event on broader but lessgranular information sources if they areavailable. This seeks to include IDPs livingwith host communities and in other dispersedsettings, both within and beyondthe areas affected by a given disaster. Inmany cases, however, the only informationwe are able to identify refers to aparticular segment of the displaced population,such as those living in officiallyrecognised sites, and as such the figurewe record in many cases is likely to be anunderestimate.Event-specific dataWe only record new displacement inour annual datasets when the informationavailable allows event-specific estimatesto be made. We do not use figures thatwe are unable to break down, such asthose already aggregated at the nationallevel, for a whole year or by type of hazardor disaster. This enable verification andensures consistency and comparabilityacross the data captured.For this reason we did not include 2014estimates for South Korea and Angola,and they are not included in the 2014dataset. It is worth noting that for othercountries where alternative event-baseddata was found, official, pre-aggregatedstatistics gave a higher estimate of totaldisplacement than our own, most likelybecause some events were missing fromour data and/or because we underestimatedthe displacement involved in oneor more of that year’s events. This was thecase for aggregated data for 2014 fromChina and Nepal.Events caused by “unnatural” hazardsWe have excluded events related tohazards that were clearly not “natural”in origin from our 2014 data. In Iraq, forexample, we did not include the displacementcaused by flooding after IslamicState insurgents destroyed a dam. Giventhat the destruction was not a response todangerously high water levels behind thedam, we classified the event as conflictrelatedinstead. As discussed in section 2of the report on concepts and definitions,it is often difficult to determine whetherhazards are more natural or manmade,particularly where floods, landslides andwildfires are concerned.Defining a displacement event and itssizeOur data includes events of all sizes,ranging from a few records of only oneIDP to mass displacements of more than15 million people, but the sources availableand our methodology create a biastowards larger, more visible and morewidely reported events. Frequent smallscaledisplacements are included wheneverinformation is available, but suchevents are underreported.We only recorded displacements offewer than 100 people in 29 countries in2014, less than a third of those covered.From this, we can infer that frequent andwidely occurring small-scale events aresignificantly under-reported for mostcountries, as discussed in section 2. Datafor Pakistan and Timor-Leste came fromnational Desinventar disaster loss databases,and for Colombia and Indonesiafrom government-hosted online databases.US data was captured from theFederal Emergency Management Agency’ssituation reports. IFRC, IOM, nationalsocieties and the media yielded most ofthe data for the remaining countries.Our 2014 data includes a significantincrease in the recording of smaller-scaleextensive disasters. Highly detailed informationon small local events was aggregatedwhen they were clearly identifiableas related to a main weather system,flood season or other hazard, includingsecondary hazards such as landslidesduring a period of flooding. This type ofaggregation is widely used in the internationalreporting of disasters, and weapplied it to 71 events in nine countries in2014. 2 Detailed records of sub-events aremaintained in our database to facilitatemore granular analysis in the future.Our data also includes reported disastersfor which no displacement was recorded.If information was not available tocompile an estimate in accordance withour methodology, it was recorded as “nodata available”, while those for whichsources explicitly stated that no displacementoccurred were recorded as “zerodisplaced”. The difference is important tonote, because it is much more commonfor the scale of displacement associatedwith a disaster to be unknown than confirmedas zero.Defining the duration of a disasterDefining and classifying a disasterperiod can be challenging in terms of itsstart and end date, and its complexity beyondthe direct impact of the main hazard,where such a hazard is clearly discernable.In reality, a disaster usually involvesa number of sub-events and phases. Thisis particularly true of displacement acrosswide areas during successive periods ofheavy rainfall together with secondaryhazards such as landslides, or when similarevents happen in parallel or close successionin the same country or locality.As the Dartmouth Flood Observatorynotes: “Repeat flooding in some regions isa complex phenomenon and may requirea compromise between aggregating anddividing such events”. 2 The issue does notalter the overall estimate of the numberof people displaced, but it does affect thenumber of events recorded and the analysisof those events according to their size.Annexes81
- Page 1:
Global Estimates 2015People displac
- Page 4 and 5:
IDMC core project teamCoordinator/l
- Page 7 and 8:
5. Mind your assumptions: Protracte
- Page 9 and 10:
FIGURES, TABLES AND MAPSFigure 2.1:
- Page 11 and 12:
Modelled global displacement trend
- Page 13 and 14:
1INTRODUCTIONSince 2008, an average
- Page 15 and 16:
2CONCEPTUALISINGDISPLACEMENTin the
- Page 17 and 18:
Box 2.1: Slow-onset hazards and gra
- Page 19 and 20:
Repeated and frequent displacementR
- Page 21 and 22:
3THE GLOBAL PICTUREScale, patterns
- Page 23 and 24:
Figure 3.2: Global displacement by
- Page 25 and 26:
Box 3.1: “Super” El Niño and d
- Page 27 and 28:
While more resilient families may b
- Page 30 and 31:
28 Global Estimates 2015A woman sta
- Page 32 and 33: 4.1 RegionsAs in previous years, As
- Page 34 and 35: 4.2 CountriesThe number of people d
- Page 36 and 37: forward, the municipalities of Pasc
- Page 38 and 39: 4.4 The big three: China, India and
- Page 40 and 41: Map 4.1: Philippines regions affect
- Page 42 and 43: Displacement caused by seasonalfloo
- Page 44 and 45: 4.6 Multiple hazards in fragile and
- Page 46 and 47: SPOTLIGHTAFGHANISTANBlurred lines b
- Page 48 and 49: 46 Global Estimates 2015A displaced
- Page 50 and 51: The global data presented in this r
- Page 52 and 53: The international experts we interv
- Page 54 and 55: perstorm Sandy in 2009, and indigen
- Page 56 and 57: SPOTLIGHTPAPUA NEW GUINEAManam isla
- Page 58 and 59: SPOTLIGHTINDONESIASidoarjo mudflow
- Page 60 and 61: SPOTLIGHTBANGLADESHSix years after
- Page 62 and 63: Figure 5.4: Movement of IDPs from a
- Page 64 and 65: SPOTLIGHTHAITIChronic vulnerability
- Page 66 and 67: Conditions have continued to deteri
- Page 68 and 69: Map 5.3: Ongoing displacement in th
- Page 70 and 71: The mental and physical health ofID
- Page 72 and 73: SPOTLIGHTUNITED STATESDisplaced peo
- Page 74: assistance available and implementa
- Page 77 and 78: 6THE POST-2015GLOBAL POLICYAGENDAKe
- Page 79 and 80: A landslide devastated villages in
- Page 81: ANNEX AMethodologyIDMC’s annual G
- Page 85 and 86: Data on housing rendereduninhabitab
- Page 87 and 88: Modelling and calibration usingthe
- Page 89 and 90: We also asked each interviewee toth
- Page 91 and 92: RankingCountry Hazard Affected area
- Page 93 and 94: * Text in parentheses indicates the
- Page 95 and 96: Country DisasterStartdateTotal no.
- Page 98 and 99: Country DisasterStartdateTotal no.
- Page 100 and 101: Country DisasterStartdateTotal no.
- Page 102 and 103: REFERENCESSection 21. UNISDR, Termi
- Page 104 and 105: 34. NDRRMC, SitRep No.27 re Effects
- Page 106 and 107: nation Group, October 2009, availab
- Page 108: digidepo_8841940_po_076709.pdf?cont