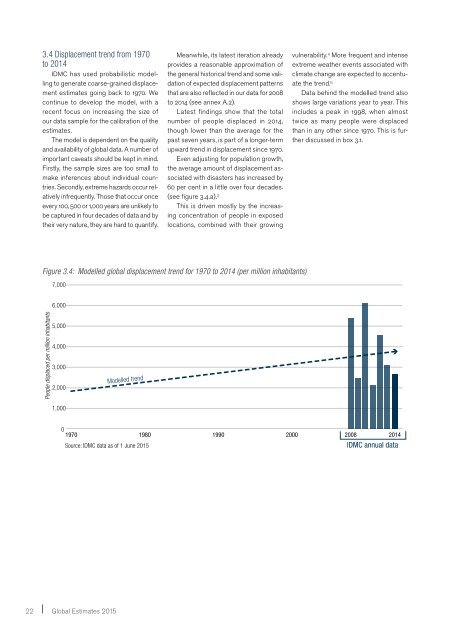
3.4 Displacement trend from 1970to 2014IDMC has used probabilistic modellingto generate coarse-grained displacementestimates going back to 1970. Wecontinue to develop the model, with arecent focus on increasing the size ofour data sample for the calibration of theestimates.The model is dependent on the qualityand availability of global data. A number ofimportant caveats should be kept in mind.Firstly, the sample sizes are too small tomake inferences about individual countries.Secondly, extreme hazards occur relativelyinfrequently. Those that occur onceevery 100, 500 or 1,000 years are unlikely tobe captured in four decades of data and bytheir very nature, they are hard to quantify.Meanwhile, its latest iteration alreadyprovides a reasonable approximation ofthe general historical trend and some validationof expected displacement patternsthat are also reflected in our data for 2008to 2014 (see annex A.2).Latest findings show that the totalnumber of people displaced in 2014,though lower than the average for thepast seven years, is part of a longer-termupward trend in displacement since 1970.Even adjusting for population growth,the average amount of displacement associatedwith disasters has increased by60 per cent in a little over four decades.(see figure 3.4.a). 3This is driven mostly by the increasingconcentration of people in exposedlocations, combined with their growingvulnerability. 4 More frequent and intenseextreme weather events associated withclimate change are expected to accentuatethe trend. 5Data behind the modelled trend alsoshows large variations year to year. Thisincludes a peak in 1998, when almosttwice as many people were displacedthan in any other since 1970. This is furtherdiscussed in box 3.1.Figure 3.4: Modelled global displacement trend for 1970 to 2014 (per million inhabitants)7,0006,000People displaced per million inhabitants People displaced per million inhabitants5,0004,0003,0002,0001,000019701980Source: IDMC data as of 1 June 20157,0006,0005,0004,0003,0002,000Modelled trendb) Trend by associated hazard typeRelated to weather hazardsRelated to geophysical hazardsModelled trend1990200020082014IDMC annual data1,00022 Global <strong>Estimates</strong> 2015019701980Modelled trend1990200020082014IDMC annual data
Box 3.1: “Super” El Niño and displacement in 1998 - a year of extremesThis year, the planet has entered a new climatic period characterised by above average sea surface temperatures in theeastern and east-central Pacific Ocean. This natural phenomenon is known as the El Niño Southern Oscillation. It occursat irregular intervals of two to seven years and lasts for nine months to two years, and it has a significant effect on patternsof extreme weather and climate-related disasters. 6 There is no consensus on how iterations of El Niño will change as theglobal climate warms, but studies suggest that they are becoming more intense. 7The strongest El Niño ever recorded occurred in 1997 and 1998. 8 It ended suddenly in the first half of 1998 and wasfollowed by a period of below average sea surface temperatures known as La Niña. 9 Severe floods in Asia, an abnormallyactive tropical storm season in the Atlantic basin, hurricanes in Central America and the Caribbean and other events allcaused major displacements (see table 3.2).Table 3.2: Large displacement events in 1998Country Disaster Number of people displacedChinaSummer floods across several wide areas, includingthe South-central Yangtze river basin14 million 10India June to August floods across 12 northern states Eight millionDominican Republic Hurricane Georges, flooding and landslides 865,000 11Honduras Hurricane Mitch, flooding and landslides 2.1 million 12The scale of displacement in the countries affected also had much to do with pre-existing patterns of development anddisaster risk, and long-lasting displacement helped to increase this risk further in some cases. Honduras is a case in point.In Honduras, more than 440,000 people lost their homes to hurricane Mitch, and a year later 20,000 were still living inshelters. 13 Hundreds of families did so for up to four years, and though information is scarce and patchy, a number of peoplewere reported as still displaced ten years after Mitch struck. 14Some returned to their places of origin and rebuilt their homes using inadequate materials, continuing their exposureand vulnerability to future disasters. For others, return was not an option because of the extent of the devastation. Twentyfivecommunities whose villages were completely destroyed by land and mudslides relocated permanently elsewhere. 15The town of Morolica was one of the worst affected. A new town was built for its former residents five kilometres away,and seven per cent of the population relocated to urban areas or abroad. 16Mitch’s impacts were made worse by decades of unsustainable development and land use, and the poor design andlocation of public and private infrastructure. Honduras did not have a legal framework for land-use planning and buildingregulations until 2002. Poor preparedness and early warning measures, and the government’s inadequate responses tothe disaster were also factors.Half of the country’s population was living in extreme poverty before Mitch struck, and for some their level of povertyincreased in its aftermath. 17 Disasters have in the region also tend to increase food insecurity, and displaced families inHonduras suffered a serious nutritional crisis after the hurricane. 18In recognition of the country’s high exposure to natural hazards and the links between environmental degradation, highpoverty levels and increased vulnerability to disasters, the government has committed to strengthening existing legal andinstitutional frameworks to improve disaster risk management. The challenges to implementation, however, are great.As a new El Niño episode continues in 2015, how many people will be displaced by weather-related disasters and whereis unknown. It is not even certain that the phenomenon will play out as it has in the past. What is certain, however, is thatthere are now many more people living in hazard-prone areas around the world that may be affected. No matter howhazards manifest as a result of El Niño, changes in exposure and vulnerability have already increased the risk of disastersand displacement.3 | The global picture: scales, patterns and trends23
- Page 1: Global Estimates 2015People displac
- Page 4 and 5: IDMC core project teamCoordinator/l
- Page 7 and 8: 5. Mind your assumptions: Protracte
- Page 9 and 10: FIGURES, TABLES AND MAPSFigure 2.1:
- Page 11 and 12: Modelled global displacement trend
- Page 13 and 14: 1INTRODUCTIONSince 2008, an average
- Page 15 and 16: 2CONCEPTUALISINGDISPLACEMENTin the
- Page 17 and 18: Box 2.1: Slow-onset hazards and gra
- Page 19 and 20: Repeated and frequent displacementR
- Page 21 and 22: 3THE GLOBAL PICTUREScale, patterns
- Page 23: Figure 3.2: Global displacement by
- Page 27 and 28: While more resilient families may b
- Page 30 and 31: 28 Global Estimates 2015A woman sta
- Page 32 and 33: 4.1 RegionsAs in previous years, As
- Page 34 and 35: 4.2 CountriesThe number of people d
- Page 36 and 37: forward, the municipalities of Pasc
- Page 38 and 39: 4.4 The big three: China, India and
- Page 40 and 41: Map 4.1: Philippines regions affect
- Page 42 and 43: Displacement caused by seasonalfloo
- Page 44 and 45: 4.6 Multiple hazards in fragile and
- Page 46 and 47: SPOTLIGHTAFGHANISTANBlurred lines b
- Page 48 and 49: 46 Global Estimates 2015A displaced
- Page 50 and 51: The global data presented in this r
- Page 52 and 53: The international experts we interv
- Page 54 and 55: perstorm Sandy in 2009, and indigen
- Page 56 and 57: SPOTLIGHTPAPUA NEW GUINEAManam isla
- Page 58 and 59: SPOTLIGHTINDONESIASidoarjo mudflow
- Page 60 and 61: SPOTLIGHTBANGLADESHSix years after
- Page 62 and 63: Figure 5.4: Movement of IDPs from a
- Page 64 and 65: SPOTLIGHTHAITIChronic vulnerability
- Page 66 and 67: Conditions have continued to deteri
- Page 68 and 69: Map 5.3: Ongoing displacement in th
- Page 70 and 71: The mental and physical health ofID
- Page 72 and 73: SPOTLIGHTUNITED STATESDisplaced peo
- Page 74:
assistance available and implementa
- Page 77 and 78:
6THE POST-2015GLOBAL POLICYAGENDAKe
- Page 79 and 80:
A landslide devastated villages in
- Page 81 and 82:
ANNEX AMethodologyIDMC’s annual G
- Page 83 and 84:
protracted displacement situations
- Page 85 and 86:
Data on housing rendereduninhabitab
- Page 87 and 88:
Modelling and calibration usingthe
- Page 89 and 90:
We also asked each interviewee toth
- Page 91 and 92:
RankingCountry Hazard Affected area
- Page 93 and 94:
* Text in parentheses indicates the
- Page 95 and 96:
Country DisasterStartdateTotal no.
- Page 98 and 99:
Country DisasterStartdateTotal no.
- Page 100 and 101:
Country DisasterStartdateTotal no.
- Page 102 and 103:
REFERENCESSection 21. UNISDR, Termi
- Page 104 and 105:
34. NDRRMC, SitRep No.27 re Effects
- Page 106 and 107:
nation Group, October 2009, availab
- Page 108:
digidepo_8841940_po_076709.pdf?cont