Draft
Strategy for a Sustainable Region Priority ... - One Bay Area
Strategy for a Sustainable Region Priority ... - One Bay Area
- No tags were found...

Create successful ePaper yourself
Turn your PDF publications into a flip-book with our unique Google optimized e-Paper software.
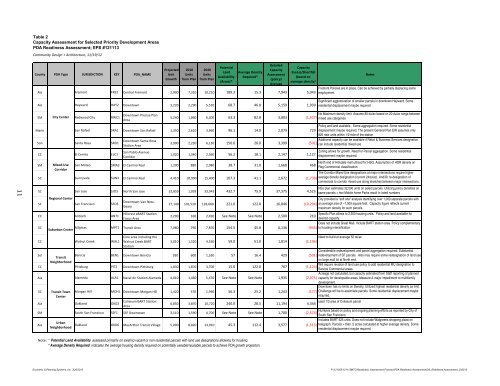
Table 2<br />
Capacity Assessment for Selected Priority Development Areas<br />
PDA Readiness Assessment; EPS #121113<br />
Community Design + Architecture, 11/19/12<br />
County PDA Type JURISDICTION KEY PDA_NAME<br />
Projected<br />
Unit<br />
Growth<br />
2010<br />
Units<br />
from Plan<br />
2040<br />
Units<br />
from Plan<br />
Potential<br />
Land<br />
Availability<br />
(Acres)*<br />
Average Density<br />
Required*<br />
Detailed<br />
Capacity<br />
Assessment<br />
(policy)<br />
Average<br />
Capacity<br />
Excess/Shortfall<br />
(based on<br />
average density)<br />
Ala Fremont FRE2 Central Fremont 2,900 7,310 10,210 189.3 15.3 7,943 5,043<br />
Ala Hayward HAY2 Downtown 3,220 2,290 5,510 68.7 46.8 5,159 1,939<br />
Notes<br />
Fremont Policies are in place. Can be achieved by partially displacing some<br />
employment.<br />
Significant agglomeration of smaller parcels in downtown Hayward. Some<br />
residential displacement maybe required<br />
11<br />
SM City Center Redwood City RWC1<br />
Downtown Precise Plan<br />
Area<br />
No Maximum density limit. Assume 80 du/ac based on 20 du/ac range between<br />
5,240 1,060 6,300 63.3 82.8 3,803 (1,437) mixed use categories<br />
Marin San Rafael SRA1 Downtown San Rafael 1,350 2,610 3,960 96.1 14.0 2,079 729<br />
Policy and land available . Some aggregation required. Some residential<br />
displacement maybe required. The present General Plan EIR assumes only<br />
825 new units within 1/2 mile of the station<br />
Son Santa Rosa SRO1<br />
Downtown Santa Rosa<br />
Station Area<br />
3,900 2,230 6,130 150.0 26.0 3,399<br />
Additional capacity can be available if Retail & Business Services designation<br />
(501) can include residential mixed use<br />
CC El Cerrito ELC1<br />
San Pablo Avenue<br />
Corridor<br />
1,020 1,340 2,360 56.2 18.1 2,147 1,127<br />
Zoning allows for growth. Need for Parcel aggregation. Some residential<br />
displacement maybe required.<br />
North end of Hillsdale mall utilized for HSG. Assumption of HDR density on<br />
Reg Commercial classification<br />
The Corridor Mixed Use designations at major intersections require higher<br />
average density designation (current 24du/ac). And/Or re-designation of<br />
commercial to corridor mixed use along stretches between major intersections.<br />
NSJ plan estimates 32,000 units on select parcels. Utilizing policy densities on<br />
same parcels + two Mobile home Parks result in listed numbers<br />
City provided a "soft site" analysis identifying over 1,000 separate parcels with<br />
27,140 101,520 128,660 221.0 122.8 16,846 (10,294) an average size of ~7,000 square feet. Capacity figure reflects current<br />
maximum density for such parcels.<br />
2,290 160 2,450 See Note See Note 2,500 210<br />
Specific Plan allows to 2,500 housing units. Policy and land available for<br />
desired capacity.<br />
Does not include Great Mall. Include BART station area. Policy complementary<br />
to housing intensification<br />
SM Mixed-Use San Mateo SMA3 El Camino Real 1,200 880 2,080 38.7 31.0 1,668 468<br />
Corridor<br />
SC Sunnyvale SUN3 El Camino Real 4,410 10,990 15,400 107.3 41.1 2,672 (1,738)<br />
SC San Jose SJO3 North San Jose 32,850 1,093 33,943 432.7 75.9 37,375 4,525<br />
Regional Center<br />
SF San Francisco SFO3<br />
CC Antioch ANT1<br />
Downtown-Van Ness-<br />
Geary<br />
Hillcrest eBART Station<br />
Focus Area<br />
SC Milpitas MPT1 Transit Area 7,080 790 7,870 154.5 45.8 6,136 (944)<br />
Suburban Center<br />
CC Walnut Creek WAL1<br />
Core area including the<br />
Walnut Creek BART<br />
Station<br />
Need to build at average 52 du/ac<br />
3,010 1,520 4,530 59.0 51.0 1,814 (1,196)<br />
Considerable redevelopment and parcel aggregation required. Substantial<br />
Sol Benicia BEN1 Downtown Benicia 930 600 1,530 57 16.4 429 (501) redevelopment of SF parcels. Also may require some redesignation of land use<br />
Transit<br />
on large mall lot at North end.<br />
Neighborhood<br />
CC Pittsburg PIT2 Downtown Pittsburg 1,830 1,870 3,700 15.0 122.0 707<br />
Will require revision of land use policy to add residential MU designation to<br />
(1,123)<br />
Service Commercial areas.<br />
Acreage not calculated, but capacity estimated from Staff reporting of planned<br />
Ala Alameda ALA1 Naval Air Station Alameda 4,010 1,460 5,470 See Note See Note 1,935 (2,075) capacity for developable areas. Measure A major impediment to multifamily<br />
development.<br />
Downtown has no limits on Density, Utilized highest residential density as limit.<br />
SC Transit Town<br />
Center<br />
Morgan Hill MOH1 Downtown Morgan Hill 1,420 570 1,990 56.3 25.2 1,243 (177) Challenge will be to assimilate parcels. Some residential displacement maybe<br />
required.<br />
Ala Oakland OKD2<br />
Coliseum BART Station<br />
used 1/3 area of Coliseum parcel<br />
6,850 3,870 10,720 240.0 28.5 11,194 4,344<br />
Area<br />
SM South San Francisco SSF1 SSF Downtown 3,110 1,590 4,700 See Note See Note 1,700<br />
Numbers based on policy and ongoing planning efforts as reported by City of<br />
(2,574)<br />
South San Francisco.<br />
Ala<br />
Includes BART 625 units. Does not include Walgreens shopping plaza on<br />
Urban<br />
Neighborhood Oakland OKD6 MacArthur Transit Village 5,090 8,820 13,910 45.3 112.4 3,577 (1,513) telegraph. Parcels > than .5 acres calculated at higher average density. Some<br />
residential displacement maybe required.<br />
Note: * Potential Land Availability assessed primarily on existing vacant or non residential parcels with land use designations allowing for housing.<br />
* Average Density Required indicates the average housing density required on potentially useable/reusable parcels to achieve PDA growth projection.<br />
Economic & Planning Systems, Inc. 3/26/2013<br />
P:\121000\121113MTC\Readiness_Assessment Process\PDA Readiness Assessment\DS_Readiness Assessment_032513