- Page 1 and 2:
Draft March 2013 Strategy for a Sus
- Page 3 and 4:
Final Report PDA Readiness Assessme
- Page 5 and 6:
1. REPORT SUMMARY AND FINDINGS Plan
- Page 7 and 8:
Table 1 Summary of PDA Readiness As
- Page 9 and 10:
PDA Readiness Assessment Final Repo
- Page 11 and 12:
2. STUDY BACKGROUND Over the past s
- Page 13 and 14:
3. PDA DEVELOPMENT READINESS ASSESS
- Page 15 and 16:
Table 2 Capacity Assessment for Sel
- Page 17 and 18:
PDA Readiness Assessment Final Repo
- Page 19 and 20:
Table 3 PDA Readiness Criteria Work
- Page 21 and 22:
Table 3 PDA Readiness Criteria Work
- Page 23 and 24:
PDA Readiness Assessment Final Repo
- Page 25 and 26:
PDA Readiness Assessment Final Repo
- Page 27 and 28:
PDA Readiness Assessment Final Repo
- Page 29 and 30:
PDA Readiness Assessment Final Repo
- Page 31 and 32:
PDA Readiness Assessment Final Repo
- Page 33 and 34:
PDA Readiness Assessment Final Repo
- Page 35 and 36:
PDA Readiness Assessment Final Repo
- Page 37 and 38:
PDA Readiness Assessment Final Repo
- Page 39 and 40:
5. POLICY ACTIONS TO IMPROVE DEVELO
- Page 41 and 42:
PDA Readiness Assessment Final Repo
- Page 43 and 44:
PDA Readiness Assessment Final Repo
- Page 45 and 46:
PDA Readiness Assessment Final Repo
- Page 47 and 48:
PDA Readiness Assessment Final Repo
- Page 49 and 50:
A-1 Units 18,000 16,000 14,000 12,0
- Page 51 and 52:
Figure 2 PDA Readiness Criteria Wor
- Page 53 and 54:
Figure 2 PDA Readiness Criteria Wor
- Page 55 and 56:
Figure 3 PDA Readiness Criteria Wor
- Page 57 and 58:
Figure 3 PDA Readiness Criteria Wor
- Page 59 and 60:
Figure 4 PDA Readiness Criteria Wor
- Page 61 and 62:
Figure 4 PDA Readiness Criteria Wor
- Page 63 and 64:
Figure 5 PDA Readiness Criteria Wor
- Page 65 and 66:
Figure 5 PDA Readiness Criteria Wor
- Page 67 and 68:
Figure 7 PDA Readiness Criteria Wor
- Page 69 and 70:
Figure 7 PDA Readiness Criteria Wor
- Page 71 and 72:
Figure 8 PDA Readiness Criteria Wor
- Page 73 and 74:
Figure 8 PDA Readiness Criteria Wor
- Page 75 and 76:
7,000 6,000 5,000 Figure 9: Redwood
- Page 77 and 78:
Figure 10 PDA Readiness Criteria Wo
- Page 79 and 80:
Figure 10 PDA Readiness Criteria Wo
- Page 81 and 82:
Figure 11 PDA Readiness Criteria Wo
- Page 83 and 84:
Figure 11 PDA Readiness Criteria Wo
- Page 85 and 86:
Figure 13 PDA Readiness Criteria Wo
- Page 87 and 88:
Figure 13 PDA Readiness Criteria Wo
- Page 89 and 90:
Figure 14 PDA Readiness Criteria Wo
- Page 91 and 92:
Figure 14 PDA Readiness Criteria Wo
- Page 93 and 94:
7,000 6,000 5,000 Figure 15: Santa
- Page 95 and 96:
Figure 16 PDA Readiness Criteria Wo
- Page 97 and 98:
Figure 16 PDA Readiness Criteria Wo
- Page 99 and 100:
Figure 17 PDA Readiness Criteria Wo
- Page 101 and 102:
Figure 17 PDA Readiness Criteria Wo
- Page 103 and 104:
Figure 19 PDA Readiness Criteria Wo
- Page 105 and 106:
Figure 19 PDA Readiness Criteria Wo
- Page 107 and 108:
Figure 20 PDA Readiness Criteria Wo
- Page 109 and 110:
Figure 20 PDA Readiness Criteria Wo
- Page 111 and 112:
3,000 2,500 Figure 21: San Mateo El
- Page 113 and 114:
Figure 22 PDA Readiness Criteria Wo
- Page 115 and 116:
Figure 22 PDA Readiness Criteria Wo
- Page 117 and 118:
Figure 23 PDA Readiness Criteria Wo
- Page 119 and 120:
Figure 23 PDA Readiness Criteria Wo
- Page 121 and 122:
Figure 25 PDA Readiness Criteria Wo
- Page 123 and 124:
Figure 25 PDA Readiness Criteria Wo
- Page 125 and 126:
Figure 26 PDA Readiness Criteria Wo
- Page 127 and 128:
Figure 26 PDA Readiness Criteria Wo
- Page 129 and 130:
140,000 120,000 100,000 Figure 27:
- Page 131 and 132:
Figure 28 PDA Readiness Criteria Wo
- Page 133 and 134:
Figure 28 PDA Readiness Criteria Wo
- Page 135 and 136:
Figure 29 PDA Readiness Criteria Wo
- Page 137 and 138:
Figure 29 PDA Readiness Criteria Wo
- Page 139 and 140:
Figure 31 PDA Readiness Criteria Wo
- Page 141 and 142:
Figure 31 PDA Readiness Criteria Wo
- Page 143 and 144:
Figure 32 PDA Readiness Criteria Wo
- Page 145 and 146:
Figure 32 PDA Readiness Criteria Wo
- Page 147 and 148:
3,000 2,500 Figure 33: Antioch Hill
- Page 149 and 150:
Figure 34 PDA Readiness Criteria Wo
- Page 151 and 152:
Figure 34 PDA Readiness Criteria Wo
- Page 153 and 154:
Figure 35 PDA Readiness Criteria Wo
- Page 155 and 156:
Figure 35 PDA Readiness Criteria Wo
- Page 157 and 158:
Figure 37 PDA Readiness Criteria Wo
- Page 159 and 160:
Figure 37 PDA Readiness Criteria Wo
- Page 161 and 162:
Figure 38 PDA Readiness Criteria Wo
- Page 163 and 164:
Figure 38 PDA Readiness Criteria Wo
- Page 165 and 166:
5,000 4,500 4,000 3,500 Figure 39:
- Page 167 and 168:
Figure 40 PDA Readiness Criteria Wo
- Page 169 and 170: Figure 40 PDA Readiness Criteria Wo
- Page 171 and 172: Figure 41 PDA Readiness Criteria Wo
- Page 173 and 174: Figure 41 PDA Readiness Criteria Wo
- Page 175 and 176: Figure 43 PDA Readiness Criteria Wo
- Page 177 and 178: Figure 43 PDA Readiness Criteria Wo
- Page 179 and 180: Figure 44 PDA Readiness Criteria Wo
- Page 181 and 182: Figure 44 PDA Readiness Criteria Wo
- Page 183 and 184: 4,000 3,500 3,000 Figure 45: Pittsb
- Page 185 and 186: Figure 46 PDA Readiness Criteria Wo
- Page 187 and 188: Figure 46 PDA Readiness Criteria Wo
- Page 189 and 190: Figure 47 PDA Readiness Criteria Wo
- Page 191 and 192: Figure 47 PDA Readiness Criteria Wo
- Page 193 and 194: Figure 49 PDA Readiness Criteria Wo
- Page 195 and 196: Figure 49 PDA Readiness Criteria Wo
- Page 197 and 198: Figure 50 PDA Readiness Criteria Wo
- Page 199 and 200: Figure 50 PDA Readiness Criteria Wo
- Page 201 and 202: 2,500 2,000 Figure 51: Morgan Hill
- Page 203 and 204: Figure 52 PDA Readiness Criteria Wo
- Page 205 and 206: Figure 52 PDA Readiness Criteria Wo
- Page 207 and 208: Figure 53 PDA Readiness Criteria Wo
- Page 209 and 210: Figure 53 PDA Readiness Criteria Wo
- Page 211 and 212: Figure 55 PDA Readiness Criteria Wo
- Page 213 and 214: Figure 55 PDA Readiness Criteria Wo
- Page 215 and 216: Figure 56 PDA Readiness Criteria Wo
- Page 217 and 218: Figure 56 PDA Readiness Criteria Wo
- Page 219: 5,000 4,500 4,000 3,500 Figure 57:
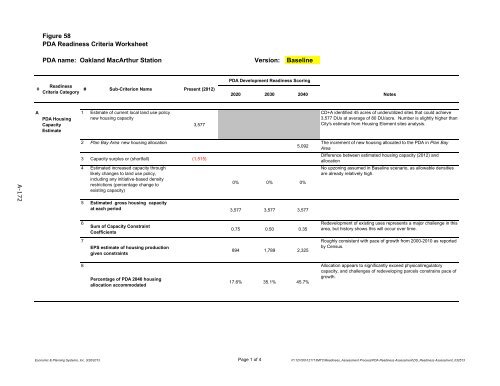
- Page 223 and 224: Figure 58 PDA Readiness Criteria Wo
- Page 225 and 226: Figure 59 PDA Readiness Criteria Wo
- Page 227 and 228: Figure 59 PDA Readiness Criteria Wo
- Page 229 and 230: Metropolitan Transportation Commiss