
Create successful ePaper yourself
Turn your PDF publications into a flip-book with our unique Google optimized e-Paper software.
SAPPI<br />
NOTES TO THE GROUP ANNUAL FINANCIAL STATEMENTS (Continued)<br />
for the year ended September <strong><strong>20</strong>06</strong><br />
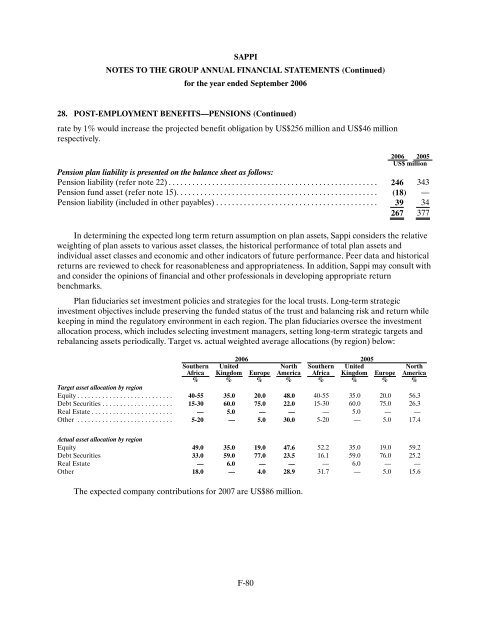
28. POST-EMPLOYMENT BENEFITS—PENSIONS (Continued)<br />
rate by 1% would increase the projected benefit obligation by US$256 million and US$46 million<br />
respectively.<br />
F-80<br />
<strong><strong>20</strong>06</strong> <strong>20</strong>05<br />
US$ million<br />
Pension plan liability is presented on the balance sheet as follows:<br />
Pension liability (refer note 22)..................................................... 246 343<br />
Pension fund asset (refer note 15)................................................... (18 ) —<br />
Pension liability (included in other payables)......................................... 39 34<br />
267 377<br />
In determining the expected long term return assumption on plan assets, <strong>Sappi</strong> considers the relative<br />
weighting of plan assets to various asset classes, the historical performance of total plan assets and<br />
individual asset classes and economic and other indicators of future performance. Peer data and historical<br />
returns are reviewed to check for reasonableness and appropriateness. In addition, <strong>Sappi</strong> may consult with<br />
and consider the opinions of financial and other professionals in developing appropriate return<br />
benchmarks.<br />
Plan fiduciaries set investment policies and strategies for the local trusts. Long-term strategic<br />
investment objectives include preserving the funded status of the trust and balancing risk and return while<br />
keeping in mind the regulatory environment in each region. The plan fiduciaries oversee the investment<br />
allocation process, which includes selecting investment managers, setting long-term strategic targets and<br />
rebalancing assets periodically. Target vs. actual weighted average allocations (by region) below:<br />
<strong><strong>20</strong>06</strong> <strong>20</strong>05<br />
Southern United<br />
North Southern United<br />
North<br />
Africa Kingdom Europe America Africa Kingdom Europe America<br />
% % % % % % % %<br />
Target asset allocation by region<br />
Equity........................... 40-55 35.0 <strong>20</strong>.0 48.0 40-55 35.0 <strong>20</strong>.0 56.3<br />
Debt Securities.................... 15-30 60.0 75.0 22.0 15-30 60.0 75.0 26.3<br />
Real Estate....................... — 5.0 — — — 5.0 — —<br />
Other ........................... 5-<strong>20</strong> — 5.0 30.0 5-<strong>20</strong> — 5.0 17.4<br />
Actual asset allocation by region<br />
Equity 49.0 35.0 19.0 47.6 52.2 35.0 19.0 59.2<br />
Debt Securities 33.0 59.0 77.0 23.5 16.1 59.0 76.0 25.2<br />
Real Estate — 6.0 — — — 6.0 — —<br />
Other 18.0 — 4.0 28.9 31.7 — 5.0 15.6<br />
The expected company contributions for <strong>20</strong>07 are US$86 million.