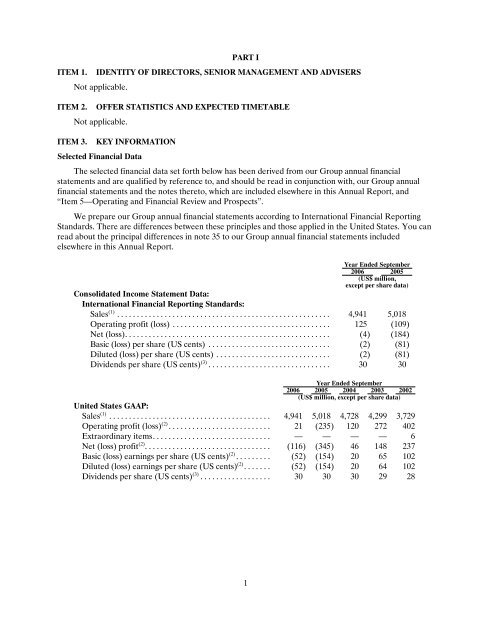
- Page 1 and 2: As filed with the Securities and Ex
- Page 3 and 4: OUR USE OF TERMS AND CONVENTIONS IN
- Page 5: FORWARD-LOOKING STATEMENTS In order
- Page 9 and 10: Risk Factors In addition to other i
- Page 11 and 12: New technologies or changes in cons
- Page 13 and 14: Several customers account for a sig
- Page 15 and 16: Maintain a global presence. One of
- Page 17 and 18: Major Product Categories Descriptio
- Page 19 and 20: market share was negatively affecte
- Page 21 and 22: The chart below represents the oper
- Page 23 and 24: The following table sets forth appr
- Page 25 and 26: Paper North America’s on-line fin
- Page 27 and 28: of 860,000 metric tonnes of triple-
- Page 29 and 30: a capacity of 60,000 metric tonnes
- Page 31 and 32: customers use our products in the p
- Page 33 and 34: (1) The following table sets forth
- Page 35 and 36: The mill markets paper and excess p
- Page 37 and 38: Pulp Sappi Fine Paper North America
- Page 39 and 40: equired for its operations. Sappi F
- Page 41 and 42: • The National Environmental Mana
- Page 43 and 44: PROPERTY, PLANT AND EQUIPMENT For a
- Page 45 and 46: ITEM 5. OPERATING AND FINANCIAL REV
- Page 47 and 48: ) Movement in market prices for our
- Page 49 and 50: The recent price history for benchm
- Page 51 and 52: Demand from all of the market segme
- Page 53 and 54: Raw Material and Other Input Costs
- Page 55 and 56: The exchange rate impact on raw mat
- Page 57 and 58:
Our South African businesses have f
- Page 59 and 60:
• Any debtors or creditors not in
- Page 61 and 62:
Year Ended September 2006 Compared
- Page 63 and 64:
US$28 million. Decreased selling pr
- Page 65 and 66:
enefit of the reversal of the Usutu
- Page 67 and 68:
accounting mismatch, as a result of
- Page 69 and 70:
South African residents, who are na
- Page 71 and 72:
The increase of US$11 million in fi
- Page 73 and 74:
June 2010. The OeKB A tranche and t
- Page 75 and 76:
impact on liquidity varies accordin
- Page 77 and 78:
Contractual Obligations We have var
- Page 79 and 80:
mill is located in Nanchang, the ca
- Page 81 and 82:
product pricing, raw material costs
- Page 83 and 84:
flows of the related underlying exp
- Page 85 and 86:
increases, health care cost trends,
- Page 87 and 88:
alance sheet date. Risks, uncertain
- Page 89 and 90:
If the Group had applied IFRS 3 ret
- Page 91 and 92:
IFRS. The Group did not apply the e
- Page 93 and 94:
Where BEE equity credentials are ob
- Page 95 and 96:
Environmental Matters We operate in
- Page 97 and 98:
Klaas de Kluis (70) (independent).
- Page 99 and 100:
Mark Richard Thompson (54) BCom, BA
- Page 101 and 102:
Audit Committee An Audit Committee
- Page 103 and 104:
estructuring initiatives that occur
- Page 105 and 106:
Levies Act, was paid via Internal R
- Page 107 and 108:
Pursuant to the Companies Amendment
- Page 109 and 110:
on Restitution of Land Rights and a
- Page 111 and 112:
(“the Depositary”) with respect
- Page 113 and 114:
• any proposal concerning the ado
- Page 115 and 116:
Voting Rights Subject to any rights
- Page 117 and 118:
equest not less than one-twentieth
- Page 119 and 120:
Financial Assistance The Bill enhan
- Page 121 and 122:
At the Annual General Meeting of Sh
- Page 123 and 124:
African shareholders will be paid t
- Page 125 and 126:
purpose of Capital Gains Tax in Sou
- Page 127 and 128:
Distributions. The gross amount of
- Page 129 and 130:
US Federal Income Tax Consequences
- Page 131 and 132:
PART II ITEM 13. DEFAULTS, DIVIDEND
- Page 133 and 134:
the controls may become inadequate
- Page 135 and 136:
ITEM 16E. PURCHASES OF EQUITY SECUR
- Page 137 and 138:
4.10 Credit Facility, dated May 7,
- Page 139 and 140:
SAPPI Group Annual Financial Statem
- Page 141 and 142:
SAPPI GROUP INCOME STATEMENT for th
- Page 143 and 144:
SAPPI GROUP CASH FLOW STATEMENT for
- Page 145 and 146:
1. BUSINESS SAPPI NOTES TO THE GROU
- Page 147 and 148:
SAPPI NOTES TO THE GROUP ANNUAL FIN
- Page 149 and 150:
SAPPI NOTES TO THE GROUP ANNUAL FIN
- Page 151 and 152:
SAPPI NOTES TO THE GROUP ANNUAL FIN
- Page 153 and 154:
SAPPI NOTES TO THE GROUP ANNUAL FIN
- Page 155 and 156:
SAPPI NOTES TO THE GROUP ANNUAL FIN
- Page 157 and 158:
SAPPI NOTES TO THE GROUP ANNUAL FIN
- Page 159 and 160:
SAPPI NOTES TO THE GROUP ANNUAL FIN
- Page 161 and 162:
SAPPI NOTES TO THE GROUP ANNUAL FIN
- Page 163 and 164:
SAPPI NOTES TO THE GROUP ANNUAL FIN
- Page 165 and 166:
SAPPI NOTES TO THE GROUP ANNUAL FIN
- Page 167 and 168:
SAPPI NOTES TO THE GROUP ANNUAL FIN
- Page 169 and 170:
SAPPI NOTES TO THE GROUP ANNUAL FIN
- Page 171 and 172:
SAPPI NOTES TO THE GROUP ANNUAL FIN
- Page 173 and 174:
SAPPI NOTES TO THE GROUP ANNUAL FIN
- Page 175 and 176:
SAPPI NOTES TO THE GROUP ANNUAL FIN
- Page 177 and 178:
SAPPI NOTES TO THE GROUP ANNUAL FIN
- Page 179 and 180:
SAPPI NOTES TO THE GROUP ANNUAL FIN
- Page 181 and 182:
SAPPI NOTES TO THE GROUP ANNUAL FIN
- Page 183 and 184:
SAPPI NOTES TO THE GROUP ANNUAL FIN
- Page 185 and 186:
4.2 Employee cost SAPPI NOTES TO TH
- Page 187 and 188:
SAPPI NOTES TO THE GROUP ANNUAL FIN
- Page 189 and 190:
SAPPI NOTES TO THE GROUP ANNUAL FIN
- Page 191 and 192:
SAPPI NOTES TO THE GROUP ANNUAL FIN
- Page 193 and 194:
SAPPI NOTES TO THE GROUP ANNUAL FIN
- Page 195 and 196:
SAPPI NOTES TO THE GROUP ANNUAL FIN
- Page 197 and 198:
SAPPI NOTES TO THE GROUP ANNUAL FIN
- Page 199 and 200:
SAPPI NOTES TO THE GROUP ANNUAL FIN
- Page 201 and 202:
SAPPI NOTES TO THE GROUP ANNUAL FIN
- Page 203 and 204:
SAPPI NOTES TO THE GROUP ANNUAL FIN
- Page 205 and 206:
SAPPI NOTES TO THE GROUP ANNUAL FIN
- Page 207 and 208:
SAPPI NOTES TO THE GROUP ANNUAL FIN
- Page 209 and 210:
SAPPI NOTES TO THE GROUP ANNUAL FIN
- Page 211 and 212:
SAPPI NOTES TO THE GROUP ANNUAL FIN
- Page 213 and 214:
SAPPI NOTES TO THE GROUP ANNUAL FIN
- Page 215 and 216:
SAPPI NOTES TO THE GROUP ANNUAL FIN
- Page 217 and 218:
SAPPI NOTES TO THE GROUP ANNUAL FIN
- Page 219 and 220:
SAPPI NOTES TO THE GROUP ANNUAL FIN
- Page 221 and 222:
SAPPI NOTES TO THE GROUP ANNUAL FIN
- Page 223 and 224:
SAPPI NOTES TO THE GROUP ANNUAL FIN
- Page 225 and 226:
SAPPI NOTES TO THE GROUP ANNUAL FIN
- Page 227 and 228:
SAPPI NOTES TO THE GROUP ANNUAL FIN
- Page 229 and 230:
SAPPI NOTES TO THE GROUP ANNUAL FIN
- Page 231 and 232:
SAPPI NOTES TO THE GROUP ANNUAL FIN
- Page 233 and 234:
SAPPI NOTES TO THE GROUP ANNUAL FIN
- Page 235 and 236:
SAPPI NOTES TO THE GROUP ANNUAL FIN
- Page 237 and 238:
SAPPI NOTES TO THE GROUP ANNUAL FIN
- Page 239 and 240:
SAPPI NOTES TO THE GROUP ANNUAL FIN
- Page 241 and 242:
SAPPI NOTES TO THE GROUP ANNUAL FIN
- Page 243 and 244:
SAPPI NOTES TO THE GROUP ANNUAL FIN
- Page 245 and 246:
SAPPI NOTES TO THE GROUP ANNUAL FIN
- Page 247 and 248:
SAPPI NOTES TO THE GROUP ANNUAL FIN
- Page 249 and 250:
SAPPI NOTES TO THE GROUP ANNUAL FIN
- Page 251 and 252:
SAPPI NOTES TO THE GROUP ANNUAL FIN
- Page 253 and 254:
SAPPI NOTES TO THE GROUP ANNUAL FIN
- Page 255 and 256:
SAPPI NOTES TO THE GROUP ANNUAL FIN
- Page 257 and 258:
SAPPI NOTES TO THE GROUP ANNUAL FIN
- Page 259 and 260:
SAPPI NOTES TO THE GROUP ANNUAL FIN
- Page 261 and 262:
SAPPI NOTES TO THE GROUP ANNUAL FIN
- Page 263 and 264:
SAPPI CONDENSED COMPANY BALANCE SHE
- Page 265 and 266:
SAPPI CONDENSED COMPANY STATEMENT O
- Page 267 and 268:
5. OTHER INCOME 2006 2005 ZAR milli