
You also want an ePaper? Increase the reach of your titles
YUMPU automatically turns print PDFs into web optimized ePapers that Google loves.
SAPPI<br />
NOTES TO THE GROUP ANNUAL FINANCIAL STATEMENTS (Continued)<br />
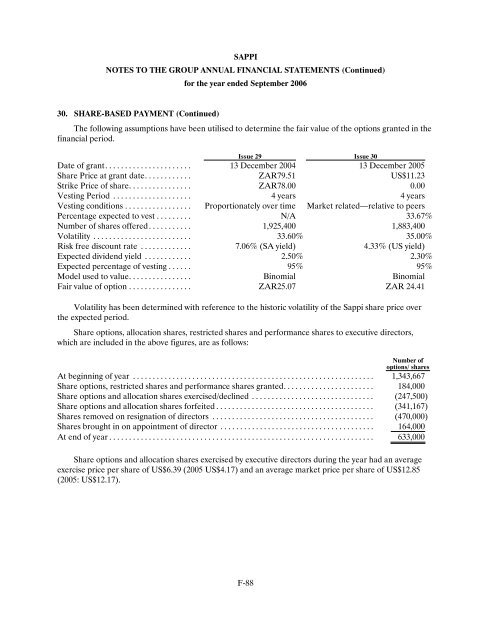
30. SHARE-BASED PAYMENT (Continued)<br />
for the year ended September <strong><strong>20</strong>06</strong><br />
The following assumptions have been utilised to determine the fair value of the options granted in the<br />
financial period.<br />
Issue 29 Issue 30<br />
Date of grant...................... 13 December <strong>20</strong>04 13 December <strong>20</strong>05<br />
Share Price at grant date............ ZAR79.51 US$11.23<br />
Strike Price of share................ ZAR78.00 0.00<br />
Vesting Period .................... 4 years 4 years<br />
Vesting conditions................. Proportionately over time Market related—relative to peers<br />
Percentage expected to vest......... N/A 33.67%<br />
Number of shares offered. . . . . . . . . . . 1,925,400 1,883,400<br />
Volatility ......................... 33.60% 35.00%<br />
Risk free discount rate ............. 7.06% (SA yield) 4.33% (US yield)<br />
Expected dividend yield ............ 2.50% 2.30%<br />
Expected percentage of vesting . . . . . . 95% 95%<br />
Model used to value................ Binomial Binomial<br />
Fair value of option................ ZAR25.07 ZAR 24.41<br />
Volatility has been determined with reference to the historic volatility of the <strong>Sappi</strong> share price over<br />
the expected period.<br />
Share options, allocation shares, restricted shares and performance shares to executive directors,<br />
which are included in the above figures, are as follows:<br />
Number of<br />
options/ shares<br />
At beginning of year . . . . . . . . . . . . . . . . . . . . . . . . . . . . . . . . . . . . . . . . . . . . . . . . . . . . . . . . . . . . . 1,343,667<br />
Share options, restricted shares and performance shares granted. . . . . . . . . . . . . . . . . . . . . . . 184,000<br />
Share options and allocation shares exercised/declined ............................... (247,500)<br />
Share options and allocation shares forfeited........................................ (341,167)<br />
Shares removed on resignation of directors ......................................... (470,000)<br />
Shares brought in on appointment of director . . . . . . . . . . . . . . . . . . . . . . . . . . . . . . . . . . . . . . . 164,000<br />
At end of year . . . . . . . . . . . . . . . . . . . . . . . . . . . . . . . . . . . . . . . . . . . . . . . . . . . . . . . . . . . . . . . . . . . 633,000<br />
Share options and allocation shares exercised by executive directors during the year had an average<br />
exercise price per share of US$6.39 (<strong>20</strong>05 US$4.17) and an average market price per share of US$12.85<br />
(<strong>20</strong>05: US$12.17).<br />
F-88