

Table of Contents
Research Journal of Social Science & Management - RJSSM - The ...
Research Journal of Social Science & Management - RJSSM - The ...
- No tags were found...

You also want an ePaper? Increase the reach of your titles
YUMPU automatically turns print PDFs into web optimized ePapers that Google loves.
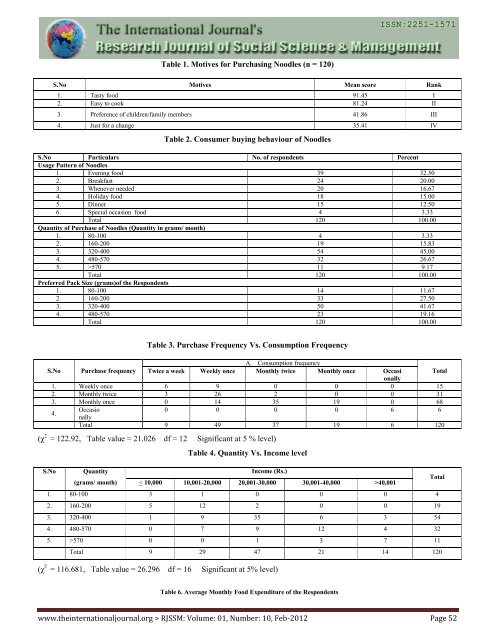
<strong>Table</strong> 1. Motives for Purchasing Noodles (n = 120)<br />
S.No Motives Mean score Rank<br />
1. Tasty food 91.45 I<br />
2. Easy to cook 81.24 II<br />
3. Preference <strong>of</strong> children/family members 41.86 III<br />
4. Just for a change 35.41 IV<br />
<strong>Table</strong> 2. Consumer buying behaviour <strong>of</strong> Noodles<br />
S.No Particulars No. <strong>of</strong> respondents Percent<br />
Usage Pattern <strong>of</strong> Noodles<br />
1. Evening food 39 32.50<br />
2. Breakfast 24 20.00<br />
3. Whenever needed 20 16.67<br />
4. Holiday food 18 15.00<br />
5. Dinner 15 12.50<br />
6. Special occasion food 4 3.33<br />
Total 120 100.00<br />
Quantity <strong>of</strong> Purchase <strong>of</strong> Noodles (Quantity in grams/ month)<br />
1. 80-100 4 3.33<br />
2. 160-200 19 15.83<br />
3. 320-400 54 45.00<br />
4. 480-570 32 26.67<br />
5. >570 11 9.17<br />
Total 120 100.00<br />
Preferred Pack Size (grams)<strong>of</strong> the Respondents<br />
1. 80-100 14 11.67<br />
2. 160-200 33 27.50<br />
3. 320-400 50 41.67<br />
4. 480-570 23 19.16<br />
Total 120 100.00<br />
<strong>Table</strong> 3. Purchase Frequency Vs. Consumption Frequency<br />
A. Consumption frequency<br />
S.No Purchase frequency Twice a week Weekly once Monthly twice Monthly once Occasi<br />
onally<br />
Total<br />
1. Weekly once 6 9 0 0 0 15<br />
2. Monthly twice 3 26 2 0 0 31<br />
3. Monthly once 0 14 35 19 0 68<br />
4.<br />
Occasio<br />
0 0 0 0 6 6<br />
nally<br />
Total 9 49 37 19 6 120<br />
(χ 2 = 122.92, <strong>Table</strong> value = 21.026 df = 12 Significant at 5 % level)<br />
S.No<br />
Quantity<br />
(grams/ month)<br />
<strong>Table</strong> 4. Quantity Vs. Income level<br />
Income (Rs.)<br />
< 10,000 10,001-20,000 20,001-30,000 30,001-40,000 >40,001<br />
1. 80-100 3 1 0 0 0 4<br />
2. 160-200 5 12 2 0 0 19<br />
3. 320-400 1 9 35 6 3 54<br />
4. 480-570 0 7 9 12 4 32<br />
5. >570 0 0 1 3 7 11<br />
Total 9 29 47 21 14 120<br />
(χ 2 = 116.681, <strong>Table</strong> value = 26.296 df = 16 Significant at 5% level)<br />
Total<br />
<strong>Table</strong> 6. Average Monthly Food Expenditure <strong>of</strong> the Respondents<br />
www.theinternationaljournal.org > RJSSM: Volume: 01, Number: 10, Feb-2012 Page 52


