

Table of Contents
Research Journal of Social Science & Management - RJSSM - The ...
Research Journal of Social Science & Management - RJSSM - The ...
- No tags were found...

You also want an ePaper? Increase the reach of your titles
YUMPU automatically turns print PDFs into web optimized ePapers that Google loves.
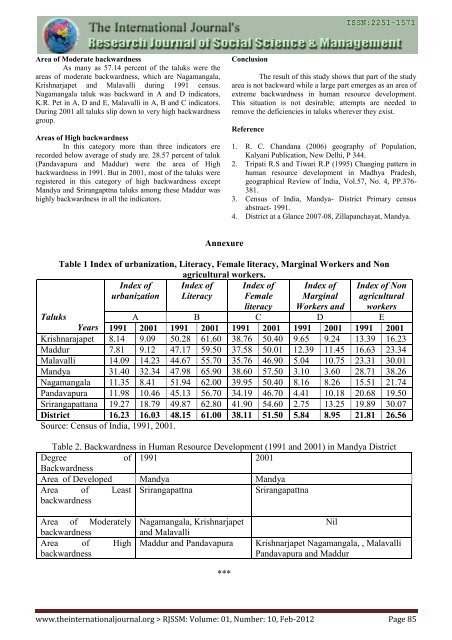
Area <strong>of</strong> Moderate backwardness<br />
As many as 57.14 percent <strong>of</strong> the taluks were the<br />
areas <strong>of</strong> moderate backwardness, which are Nagamangala,<br />
Krishnarjapet and Malavalli during 1991 census.<br />
Nagamangala taluk was backward in A and D indicators,<br />
K.R. Pet in A, D and E, Malavalli in A, B and C indicators.<br />
During 2001 all taluks slip down to very high backwardness<br />
group.<br />
Areas <strong>of</strong> High backwardness<br />
In this category more than three indicators ere<br />
recorded below average <strong>of</strong> study are. 28.57 percent <strong>of</strong> taluk<br />
(Pandavapura and Maddur) were the area <strong>of</strong> High<br />
backwardness in 1991. But in 2001, most <strong>of</strong> the taluks were<br />
registered in this category <strong>of</strong> high backwardness except<br />
Mandya and Srirangapttna taluks among these Maddur was<br />
highly backwardness in all the indicators.<br />
Conclusion<br />
The result <strong>of</strong> this study shows that part <strong>of</strong> the study<br />
area is not backward while a large part emerges as an area <strong>of</strong><br />
extreme backwardness in human resource development.<br />
This situation is not desirable; attempts are needed to<br />
remove the deficiencies in taluks wherever they exist.<br />
Reference<br />
1. R. C. Chandana (2006) geography <strong>of</strong> Population,<br />
Kalyani Publication, New Delhi, P 344.<br />
2. Tripati R.S and Tiwari R.P (1995) Changing pattern in<br />
human resource development in Madhya Pradesh,<br />
geographical Review <strong>of</strong> India, Vol.57, No. 4, PP.376-<br />
381.<br />
3. Census <strong>of</strong> India, Mandya- District Primary census<br />
abstract- 1991.<br />
4. District at a Glance 2007-08, Zillapanchayat, Mandya.<br />
Taluks<br />
Annexure<br />
<strong>Table</strong> 1 Index <strong>of</strong> urbanization, Literacy, Female literacy, Marginal Workers and Non<br />
agricultural workers.<br />
Index <strong>of</strong> Index <strong>of</strong> Index <strong>of</strong> Index <strong>of</strong><br />
urbanization Literacy Female Marginal<br />
Index <strong>of</strong> Non<br />
agricultural<br />
workers<br />
literacy Workers and<br />
A B C D E<br />
1991 2001 1991 2001 1991 2001 1991 2001 1991 2001<br />
Years<br />
Krishnarajapet 8.14 9.09 50.28 61.60 38.76 50.40 9.65 9.24 13.39 16.23<br />
Maddur 7.81 9.12 47.17 59.50 37.58 50.01 12.39 11.45 16.63 23.34<br />
Malavalli 14.09 14.23 44.67 55.70 35.76 46.90 5.04 10.75 23.31 30.01<br />
Mandya 31.40 32.34 47.98 65.90 38.60 57.50 3.10 3.60 28.71 38.26<br />
Nagamangala 11.35 8.41 51.94 62.00 39.95 50.40 8.16 8.26 15.51 21.74<br />
Pandavapura 11.98 10.46 45.13 56.70 34.19 46.70 4.41 10.18 20.68 19.50<br />
Srirangapattana 19.27 18.79 49.87 62.80 41.90 54.60 2.75 13.25 19.89 30.07<br />
District 16.23 16.03 48.15 61.00 38.11 51.50 5.84 8.95 21.81 26.56<br />
Source: Census <strong>of</strong> India, 1991, 2001.<br />
<strong>Table</strong> 2. Backwardness in Human Resource Development (1991 and 2001) in Mandya District<br />
Degree<br />
<strong>of</strong> 1991 2001<br />
Backwardness<br />
Area <strong>of</strong> Developed Mandya Mandya<br />
Area <strong>of</strong> Least Srirangapattna<br />
Srirangapattna<br />
backwardness<br />
Area <strong>of</strong> Moderately<br />
backwardness<br />
Area <strong>of</strong> High<br />
backwardness<br />
Nagamangala, Krishnarjapet<br />
and Malavalli<br />
Maddur and Pandavapura<br />
***<br />
Nil<br />
Krishnarjapet Nagamangala, , Malavalli<br />
Pandavapura and Maddur<br />
www.theinternationaljournal.org > RJSSM: Volume: 01, Number: 10, Feb-2012 Page 85


