

BEUTEL GOODMAN MANAGED FUNDS
Annual Financial Report - Beutel, Goodman & Company Ltd.
Annual Financial Report - Beutel, Goodman & Company Ltd.

Create successful ePaper yourself
Turn your PDF publications into a flip-book with our unique Google optimized e-Paper software.
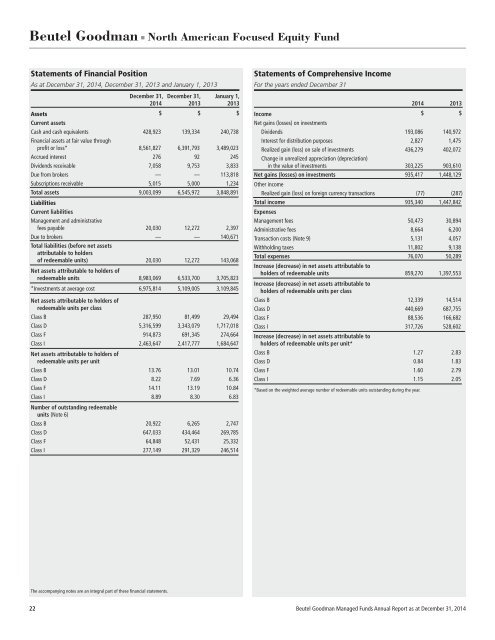
Beutel Goodman ■ North American Focused Equity Fund<br />
Statements of Financial Position<br />
As at December 31, 2014, December 31, 2013 and January 1, 2013<br />
December 31, December 31, January 1,<br />
2014 2013 2013<br />
Assets<br />
$ $ $<br />
Current assets<br />
Cash and cash equivalents 428,923 139,334 240,738<br />
Financial assets at fair value through<br />
profit or loss* 8,561,827 6,391,793 3,489,023<br />
Accrued interest 276 92 245<br />
Dividends receivable 7,058 9,753 3,833<br />
Due from brokers — — 113,818<br />
Subscriptions receivable 5,015 5,000 1,234<br />
Total assets 9,003,099 6,545,972 3,848,891<br />
Liabilities<br />
Current liabilities<br />
Management and administrative<br />
fees payable 20,030 12,272 2,397<br />
Due to brokers — — 140,671<br />
Total liabilities (before net assets<br />
attributable to holders<br />
of redeemable units) 20,030 12,272 143,068<br />
Net assets attributable to holders of<br />
redeemable units 8,983,069 6,533,700 3,705,823<br />
*Investments at average cost 6,975,814 5,109,005 3,109,845<br />
Net assets attributable to holders of<br />
redeemable units per class<br />
Class B 287,950 81,499 29,494<br />
Class D 5,316,599 3,343,079 1,717,018<br />
Class F 914,873 691,345 274,664<br />
Class I 2,463,647 2,417,777 1,684,647<br />
Net assets attributable to holders of<br />
redeemable units per unit<br />
Class B 13.76 13.01 10.74<br />
Class D 8.22 7.69 6.36<br />
Class F 14.11 13.19 10.84<br />
Class I 8.89 8.30 6.83<br />
Number of outstanding redeemable<br />
units (Note 6)<br />
Class B 20,922 6,265 2,747<br />
Class D 647,033 434,464 269,785<br />
Class F 64,848 52,431 25,332<br />
Class I 277,149 291,329 246,514<br />
Statements of Comprehensive Income<br />
For the years ended December 31<br />
Income<br />
Net gains (losses) on investments<br />
2014 2013<br />
$ $<br />
Dividends 193,086 140,972<br />
Interest for distribution purposes 2,827 1,475<br />
Realized gain (loss) on sale of investments 436,279 402,072<br />
Change in unrealized appreciation (depreciation)<br />
in the value of investments 303,225 903,610<br />
Net gains (losses) on investments 935,417 1,448,129<br />
Other income<br />
Realized gain (loss) on foreign currency transactions (77) (287)<br />
Total income 935,340 1,447,842<br />
Expenses<br />
Management fees 50,473 30,894<br />
Administrative fees 8,664 6,200<br />
Transaction costs (Note 9) 5,131 4,057<br />
Withholding taxes 11,802 9,138<br />
Total expenses 76,070 50,289<br />
Increase (decrease) in net assets attributable to<br />
holders of redeemable units 859,270 1,397,553<br />
Increase (decrease) in net assets attributable to<br />
holders of redeemable units per class<br />
Class B 12,339 14,514<br />
Class D 440,669 687,755<br />
Class F 88,536 166,682<br />
Class I 317,726 528,602<br />
Increase (decrease) in net assets attributable to<br />
holders of redeemable units per unit*<br />
Class B 1.27 2.83<br />
Class D 0.84 1.83<br />
Class F 1.60 2.79<br />
Class I 1.15 2.05<br />
*Based on the weighted average number of redeemable units outstanding during the year.<br />
The accompanying notes are an integral part of these financial statements.<br />
22 Beutel Goodman Managed Funds Annual Report as at December 31, 2014