

BEUTEL GOODMAN MANAGED FUNDS
Annual Financial Report - Beutel, Goodman & Company Ltd.
Annual Financial Report - Beutel, Goodman & Company Ltd.

Create successful ePaper yourself
Turn your PDF publications into a flip-book with our unique Google optimized e-Paper software.
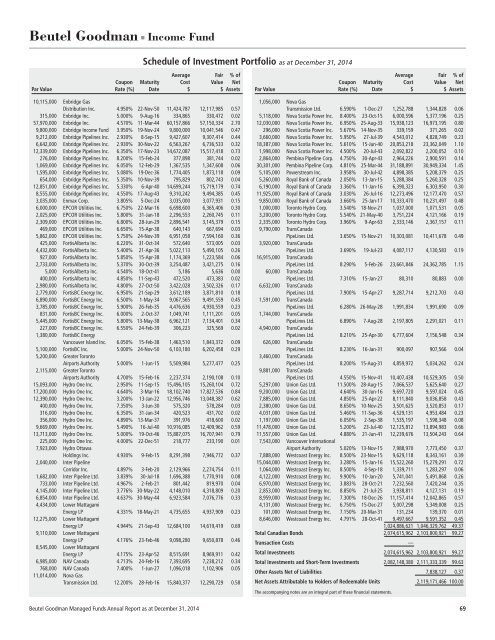
Beutel Goodman ■ Income Fund<br />
Schedule of Investment Portfolio as at December 31, 2014<br />
Average Fair % of<br />
Coupon Maturity Cost Value Net<br />
Par Value Rate (%) Date $ $ Assets<br />
10,115,000 Enbridge Gas<br />
Distribution Inc. 4.950% 22-Nov-50 11,424,787 12,117,985 0.57<br />
315,000 Enbridge Inc. 5.000% 9-Aug-16 334,865 330,472 0.02<br />
57,970,000 Enbridge Inc. 4.570% 11-Mar-44 60,157,866 57,150,334 2.70<br />
9,800,000 Enbridge Income Fund 3.950% 19-Nov-24 9,800,000 10,041,546 0.47<br />
9,212,000 Enbridge Pipelines Inc. 2.930% 8-Sep-15 9,427,607 9,307,414 0.44<br />
6,642,000 Enbridge Pipelines Inc. 2.930% 30-Nov-22 6,563,267 6,736,533 0.32<br />
12,339,000 Enbridge Pipelines Inc. 6.350% 17-Nov-23 14,672,087 15,517,418 0.73<br />
276,000 Enbridge Pipelines Inc. 8.200% 15-Feb-24 377,898 381,744 0.02<br />
1,069,000 Enbridge Pipelines Inc. 6.050% 12-Feb-29 1,367,535 1,347,608 0.06<br />
1,595,000 Enbridge Pipelines Inc. 5.080% 19-Dec-36 1,774,405 1,873,118 0.09<br />
654,000 Enbridge Pipelines Inc. 5.350% 10-Nov-39 795,829 802,743 0.04<br />
12,851,000 Enbridge Pipelines Inc. 5.330% 6-Apr-40 14,699,244 15,719,179 0.74<br />
8,555,000 Enbridge Pipelines Inc. 4.550% 17-Aug-43 9,310,242 9,494,385 0.45<br />
3,035,000 Enmax Corp. 3.805% 5-Dec-24 3,035,000 3,077,931 0.15<br />
6,000,000 EPCOR Utilities Inc. 6.750% 22-Mar-16 6,698,600 6,365,406 0.30<br />
2,025,000 EPCOR Utilities Inc. 5.800% 31-Jan-18 2,296,553 2,260,745 0.11<br />
2,309,000 EPCOR Utilities Inc. 6.800% 28-Jun-29 2,896,541 3,145,379 0.15<br />
469,000 EPCOR Utilities Inc. 6.650% 15-Apr-38 640,143 667,694 0.03<br />
5,862,000 EPCOR Utilities Inc. 5.750% 24-Nov-39 6,951,058 7,594,160 0.36<br />
425,000 FortisAlberta Inc. 6.220% 31-Oct-34 572,640 573,005 0.03<br />
4,432,000 FortisAlberta Inc. 5.400% 21-Apr-36 5,022,113 5,490,105 0.26<br />
927,000 FortisAlberta Inc. 5.850% 15-Apr-38 1,174,369 1,223,584 0.06<br />
2,733,000 FortisAlberta Inc. 5.370% 30-Oct-39 3,254,487 3,421,275 0.16<br />
5,000 FortisAlberta Inc. 4.540% 18-Oct-41 5,186 5,636 0.00<br />
400,000 FortisAlberta Inc. 4.850% 11-Sep-43 472,520 473,383 0.02<br />
2,980,000 FortisAlberta Inc. 4.800% 27-Oct-50 3,422,028 3,502,326 0.17<br />
2,779,000 FortisBC Energy Inc. 6.950% 21-Sep-29 3,612,189 3,871,810 0.18<br />
6,890,000 FortisBC Energy Inc. 6.500% 1-May-34 9,067,565 9,491,559 0.45<br />
3,785,000 FortisBC Energy Inc. 5.900% 26-Feb-35 4,476,636 4,930,559 0.23<br />
831,000 FortisBC Energy Inc. 6.000% 2-Oct-37 1,049,741 1,111,201 0.05<br />
5,445,000 FortisBC Energy Inc. 5.800% 13-May-38 6,962,121 7,134,401 0.34<br />
227,000 FortisBC Energy Inc. 6.550% 24-Feb-39 306,223 325,569 0.02<br />
1,380,000 FortisBC Energy<br />
Vancouver Island Inc. 6.050% 15-Feb-38 1,463,510 1,843,372 0.09<br />
5,100,000 FortisBC Inc. 5.000% 24-Nov-50 6,103,180 6,202,458 0.29<br />
5,200,000 Greater Toronto<br />
Airports Authority 5.000% 1-Jun-15 5,509,984 5,277,477 0.25<br />
2,115,000 Greater Toronto<br />
Airports Authority 4.700% 15-Feb-16 2,237,374 2,190,108 0.10<br />
15,093,000 Hydro One Inc. 2.950% 11-Sep-15 15,496,105 15,260,104 0.72<br />
17,200,000 Hydro One Inc. 4.640% 3-Mar-16 18,102,740 17,827,536 0.84<br />
12,390,000 Hydro One Inc. 3.200% 13-Jan-22 12,956,746 13,048,387 0.62<br />
400,000 Hydro One Inc. 7.350% 3-Jun-30 575,320 578,284 0.03<br />
316,000 Hydro One Inc. 6.350% 31-Jan-34 420,523 431,702 0.02<br />
356,000 Hydro One Inc. 4.890% 13-Mar-37 391,976 418,600 0.02<br />
9,669,000 Hydro One Inc. 5.490% 16-Jul-40 10,916,085 12,409,962 0.59<br />
13,713,000 Hydro One Inc. 5.000% 19-Oct-46 15,887,075 16,707,941 0.79<br />
225,000 Hydro One Inc. 4.000% 22-Dec-51 218,777 233,190 0.01<br />
7,923,000 Hydro Ottawa<br />
Holdings Inc. 4.930% 9-Feb-15 8,291,398 7,946,772 0.37<br />
2,040,000 Inter Pipeline<br />
Corridor Inc. 4.897% 3-Feb-20 2,129,966 2,274,754 0.11<br />
1,682,000 Inter Pipeline Ltd. 3.839% 30-Jul-18 1,696,388 1,770,910 0.08<br />
733,000 Inter Pipeline Ltd. 4.967% 2-Feb-21 801,442 819,970 0.04<br />
4,145,000 Inter Pipeline Ltd. 3.776% 30-May-22 4,148,010 4,318,809 0.20<br />
6,854,000 Inter Pipeline Ltd. 4.637% 30-May-44 6,923,584 7,076,776 0.33<br />
4,434,000 Lower Mattagami<br />
Energy LP 4.331% 18-May-21 4,735,655 4,937,909 0.23<br />
12,275,000 Lower Mattagami<br />
Energy LP 4.944% 21-Sep-43 12,684,100 14,619,419 0.69<br />
9,110,000 Lower Mattagami<br />
Energy LP 4.176% 23-Feb-46 9,098,280 9,650,878 0.46<br />
8,545,000 Lower Mattagami<br />
Energy LP 4.175% 23-Apr-52 8,515,691 8,969,911 0.42<br />
6,985,000 NAV Canada 4.713% 24-Feb-16 7,393,695 7,238,212 0.34<br />
768,000 NAV Canada 7.400% 1-Jun-27 1,096,018 1,102,906 0.05<br />
11,014,000 Nova Gas<br />
Transmission Ltd. 12.200% 28-Feb-16 15,840,377 12,290,729 0.58<br />
Average Fair % of<br />
Coupon Maturity Cost Value Net<br />
Par Value Rate (%) Date $ $ Assets<br />
1,056,000 Nova Gas<br />
Transmission Ltd. 6.590% 1-Dec-27 1,252,788 1,344,828 0.06<br />
5,118,000 Nova Scotia Power Inc. 8.400% 23-Oct-15 6,000,596 5,377,196 0.25<br />
12,030,000 Nova Scotia Power Inc. 6.950% 25-Aug-33 15,938,123 16,973,195 0.80<br />
296,000 Nova Scotia Power Inc. 5.670% 14-Nov-35 339,159 371,265 0.02<br />
3,660,000 Nova Scotia Power Inc. 5.950% 27-Jul-39 4,543,012 4,828,749 0.23<br />
18,387,000 Nova Scotia Power Inc. 5.610% 15-Jun-40 20,853,218 23,362,049 1.10<br />
1,998,000 Nova Scotia Power Inc. 4.500% 20-Jul-43 2,092,822 2,200,052 0.10<br />
2,864,000 Pembina Pipeline Corp. 4.750% 30-Apr-43 2,964,226 2,900,591 0.14<br />
30,301,000 Pembina Pipeline Corp. 4.810% 25-Mar-44 31,188,891 30,949,334 1.45<br />
5,105,000 Powerstream Inc. 3.958% 30-Jul-42 4,898,385 5,208,379 0.25<br />
5,260,000 Royal Bank of Canada 2.050% 13-Jan-15 5,288,384 5,260,328 0.25<br />
6,190,000 Royal Bank of Canada 3.360% 11-Jan-16 6,390,323 6,303,950 0.30<br />
11,925,000 Royal Bank of Canada 3.030% 26-Jul-16 12,273,496 12,177,470 0.57<br />
9,850,000 Royal Bank of Canada 3.660% 25-Jan-17 10,333,470 10,231,497 0.48<br />
1,000,000 Toronto Hydro Corp. 3.540% 18-Nov-21 1,037,000 1,071,531 0.05<br />
3,200,000 Toronto Hydro Corp. 5.540% 21-May-40 3,751,224 4,121,166 0.19<br />
2,335,000 Toronto Hydro Corp. 3.960% 9-Apr-63 2,333,146 2,367,157 0.11<br />
9,790,000 TransCanada<br />
PipeLines Ltd. 3.650% 15-Nov-21 10,303,081 10,411,678 0.49<br />
3,920,000 TransCanada<br />
PipeLines Ltd. 3.690% 19-Jul-23 4,087,117 4,130,583 0.19<br />
16,915,000 TransCanada<br />
PipeLines Ltd. 8.290% 5-Feb-26 23,661,846 24,362,785 1.15<br />
60,000 TransCanada<br />
PipeLines Ltd. 7.310% 15-Jan-27 80,310 80,883 0.00<br />
6,632,000 TransCanada<br />
PipeLines Ltd. 7.900% 15-Apr-27 9,287,714 9,212,703 0.43<br />
1,591,000 TransCanada<br />
PipeLines Ltd. 6.280% 26-May-28 1,991,834 1,991,690 0.09<br />
1,744,000 TransCanada<br />
PipeLines Ltd. 6.890% 7-Aug-28 2,197,805 2,291,021 0.11<br />
4,940,000 TransCanada<br />
PipeLines Ltd. 8.210% 25-Apr-30 6,777,604 7,156,548 0.34<br />
626,000 TransCanada<br />
PipeLines Ltd. 8.230% 16-Jan-31 900,097 907,566 0.04<br />
3,460,000 TransCanada<br />
PipeLines Ltd. 8.200% 15-Aug-31 4,859,972 5,034,262 0.24<br />
9,881,000 TransCanada<br />
PipeLines Ltd. 4.550% 15-Nov-41 10,407,438 10,529,305 0.50<br />
5,297,000 Union Gas Ltd. 11.500% 28-Aug-15 7,066,537 5,625,640 0.27<br />
9,200,000 Union Gas Ltd. 4.640% 30-Jun-16 9,697,720 9,597,024 0.45<br />
7,885,000 Union Gas Ltd. 4.850% 25-Apr-22 8,111,840 9,036,858 0.43<br />
2,380,000 Union Gas Ltd. 8.650% 10-Nov-25 3,501,625 3,520,853 0.17<br />
4,031,000 Union Gas Ltd. 5.460% 11-Sep-36 4,529,131 4,953,484 0.23<br />
1,197,000 Union Gas Ltd. 6.050% 2-Sep-38 1,535,197 1,598,348 0.08<br />
11,478,000 Union Gas Ltd. 5.200% 23-Jul-40 12,125,812 13,894,983 0.66<br />
11,557,000 Union Gas Ltd. 4.880% 21-Jun-41 12,239,676 13,504,243 0.64<br />
7,543,000 Vancouver International<br />
Airport Authority 5.020% 13-Nov-15 7,988,970 7,773,450 0.37<br />
7,888,000 Westcoast Energy Inc. 8.500% 23-Nov-15 9,629,118 8,343,161 0.39<br />
15,044,000 Westcoast Energy Inc. 3.280% 15-Jan-16 15,522,260 15,279,291 0.72<br />
1,064,000 Westcoast Energy Inc. 8.500% 4-Sep-18 1,339,711 1,283,297 0.06<br />
4,122,000 Westcoast Energy Inc. 9.900% 10-Jan-20 5,741,041 5,491,868 0.26<br />
6,970,000 Westcoast Energy Inc. 3.883% 28-Oct-21 7,232,560 7,420,244 0.35<br />
2,853,000 Westcoast Energy Inc. 8.850% 21-Jul-25 3,938,811 4,127,131 0.19<br />
8,959,000 Westcoast Energy Inc. 7.300% 18-Dec-26 11,157,414 12,042,865 0.57<br />
4,131,000 Westcoast Energy Inc. 6.750% 15-Dec-27 5,007,298 5,349,008 0.25<br />
101,000 Westcoast Energy Inc. 7.150% 20-Mar-31 131,234 139,370 0.01<br />
8,646,000 Westcoast Energy Inc. 4.791% 28-Oct-41 9,497,667 9,591,352 0.45<br />
1,024,886,621 1,046,329,762 49.37<br />
Total Canadian Bonds 2,074,615,962 2,103,800,921 99.27<br />
Transaction Costs —<br />
Total Investments 2,074,615,962 2,103,800,921 99.27<br />
Total Investments and Short-Term Investments 2,082,148,380 2,111,333,339 99.63<br />
Other Assets Net of Liabilities 7,838,127 0.37<br />
Net Assets Attributable to Holders of Redeemable Units 2,119,171,466 100.00<br />
The accompanying notes are an integral part of these financial statements.<br />
Beutel Goodman Managed Funds Annual Report as at December 31, 2014 69