

BEUTEL GOODMAN MANAGED FUNDS
Annual Financial Report - Beutel, Goodman & Company Ltd.
Annual Financial Report - Beutel, Goodman & Company Ltd.

Create successful ePaper yourself
Turn your PDF publications into a flip-book with our unique Google optimized e-Paper software.
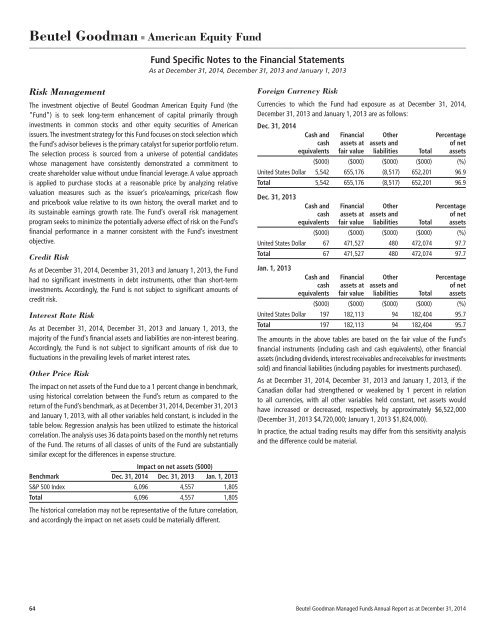
Beutel Goodman ■ American Equity Fund<br />
Fund Specific Notes to the Financial Statements<br />
As at December 31, 2014, December 31, 2013 and January 1, 2013<br />
Risk Management<br />
The investment objective of Beutel Goodman American Equity Fund (the<br />
“Fund”) is to seek long-term enhancement of capital primarily through<br />
investments in common stocks and other equity securities of American<br />
issuers. The investment strategy for this Fund focuses on stock selection which<br />
the Fund’s advisor believes is the primary catalyst for superior portfolio return.<br />
The selection process is sourced from a universe of potential candidates<br />
whose management have consistently demonstrated a commitment to<br />
create shareholder value without undue financial leverage. A value approach<br />
is applied to purchase stocks at a reasonable price by analyzing relative<br />
valuation measures such as the issuer’s price/earnings, price/cash flow<br />
and price/book value relative to its own history, the overall market and to<br />
its sustainable earnings growth rate. The Fund’s overall risk management<br />
program seeks to minimize the potentially adverse effect of risk on the Fund’s<br />
financial performance in a manner consistent with the Fund’s investment<br />
objective.<br />
Credit Risk<br />
As at December 31, 2014, December 31, 2013 and January 1, 2013, the Fund<br />
had no significant investments in debt instruments, other than short-term<br />
investments. Accordingly, the Fund is not subject to significant amounts of<br />
credit risk.<br />
Interest Rate Risk<br />
As at December 31, 2014, December 31, 2013 and January 1, 2013, the<br />
majority of the Fund’s financial assets and liabilities are non-interest bearing.<br />
Accordingly, the Fund is not subject to significant amounts of risk due to<br />
fluctuations in the prevailing levels of market interest rates.<br />
Other Price Risk<br />
The impact on net assets of the Fund due to a 1 percent change in benchmark,<br />
using historical correlation between the Fund’s return as compared to the<br />
return of the Fund’s benchmark, as at December 31, 2014, December 31, 2013<br />
and January 1, 2013, with all other variables held constant, is included in the<br />
table below. Regression analysis has been utilized to estimate the historical<br />
correlation. The analysis uses 36 data points based on the monthly net returns<br />
of the Fund. The returns of all classes of units of the Fund are substantially<br />
similar except for the differences in expense structure.<br />
Impact on net assets ($000)<br />
Benchmark Dec. 31, 2014 Dec. 31, 2013 Jan. 1, 2013<br />
S&P 500 Index 6,096 4,557 1,805<br />
Total 6,096 4,557 1,805<br />
The historical correlation may not be representative of the future correlation,<br />
and accordingly the impact on net assets could be materially different.<br />
Foreign Currency Risk<br />
Currencies to which the Fund had exposure as at December 31, 2014,<br />
December 31, 2013 and January 1, 2013 are as follows:<br />
Dec. 31, 2014<br />
Cash and Financial Other Percentage<br />
cash assets at assets and of net<br />
equivalents fair value liabilities Total assets<br />
($000) ($000) ($000) ($000) (%)<br />
United States Dollar 5,542 655,176 (8,517) 652,201 96.9<br />
Total 5,542 655,176 (8,517) 652,201 96.9<br />
Dec. 31, 2013<br />
Cash and Financial Other Percentage<br />
cash assets at assets and of net<br />
equivalents fair value liabilities Total assets<br />
($000) ($000) ($000) ($000) (%)<br />
United States Dollar 67 471,527 480 472,074 97.7<br />
Total 67 471,527 480 472,074 97.7<br />
Jan. 1, 2013<br />
Cash and Financial Other Percentage<br />
cash assets at assets and of net<br />
equivalents fair value liabilities Total assets<br />
($000) ($000) ($000) ($000) (%)<br />
United States Dollar 197 182,113 94 182,404 95.7<br />
Total 197 182,113 94 182,404 95.7<br />
The amounts in the above tables are based on the fair value of the Fund’s<br />
financial instruments (including cash and cash equivalents), other financial<br />
assets (including dividends, interest receivables and receivables for investments<br />
sold) and financial liabilities (including payables for investments purchased).<br />
As at December 31, 2014, December 31, 2013 and January 1, 2013, if the<br />
Canadian dollar had strengthened or weakened by 1 percent in relation<br />
to all currencies, with all other variables held constant, net assets would<br />
have increased or decreased, respectively, by approximately $6,522,000<br />
(December 31, 2013 $4,720,000; January 1, 2013 $1,824,000).<br />
In practice, the actual trading results may differ from this sensitivity analysis<br />
and the difference could be material.<br />
64 Beutel Goodman Managed Funds Annual Report as at December 31, 2014