

BEUTEL GOODMAN MANAGED FUNDS
Annual Financial Report - Beutel, Goodman & Company Ltd.
Annual Financial Report - Beutel, Goodman & Company Ltd.

You also want an ePaper? Increase the reach of your titles
YUMPU automatically turns print PDFs into web optimized ePapers that Google loves.
Beutel Goodman ■ World Focus Equity Fund<br />
Fund Specific Notes to the Financial Statements<br />
As at December 31, 2014, December 31, 2013 and January 1, 2013<br />
Risk Management<br />
The investment objective of the Beutel Goodman World Focus Equity Fund<br />
(the “Fund”) is to seek long term capital growth through investment in<br />
common stocks and other equity securities of global issuers. The Fund invests<br />
in a very limited number of mid-to-large capitalization stocks chosen from<br />
anywhere in the world, based primarily on the highest risk-adjusted return<br />
to Beutel Goodman’s research target price. Each of the 20–35 holdings will<br />
be among the best businesses in their respective industries, and generators<br />
of sustainable shareholder value and free cash flow. Portfolio risk and return<br />
will be judged on an absolute – not relative – basis. At all times the Fund will<br />
seek to be diversified and generally fully invested, but there will be no specific<br />
geographic or sector constraints. The Fund’s overall risk management program<br />
seeks to minimize the potentially adverse effect of risk on the Fund’s financial<br />
performance in a manner consistent with the Fund’s investment objective.<br />
Credit Risk<br />
As at December 31, 2014, December 31, 2013 and January 1, 2013, the Fund<br />
had no significant investments in debt instruments, other than short-term<br />
investments. Accordingly, the Fund is not subject to significant amounts of<br />
credit risk.<br />
Interest Rate Risk<br />
As at December 31, 2014, December 31, 2013 and January 1, 2013, the<br />
majority of the Fund’s financial assets and liabilities are non-interest bearing.<br />
Accordingly, the Fund is not subject to significant amounts of risk due to<br />
fluctuations in the prevailing levels of market interest rates.<br />
Other Price Risk<br />
The impact on net assets of the Fund due to a 1 percent change in benchmark,<br />
using historical correlation between the Fund’s return as compared to the<br />
return of the Fund’s benchmark, as at December 31, 2014, December 31,<br />
2013 and January 1, 2013, with all other variables held constant, is included<br />
in the following table. Regression analysis has been utilized to estimate the<br />
historical correlation. The analysis uses 36 data points based on the monthly<br />
net returns of the Fund. The returns of all classes of units of the Fund are<br />
substantially similar except for the differences in expense structure.<br />
Impact on net assets ($000)<br />
Benchmark Dec. 31, 2014 Dec. 31, 2013 Jan. 1, 2013<br />
MSCI World Total Return Index 122 125 12<br />
Total 122 125 12<br />
The historical correlation may not be representative of the future correlation,<br />
and accordingly the impact on net assets could be materially different.<br />
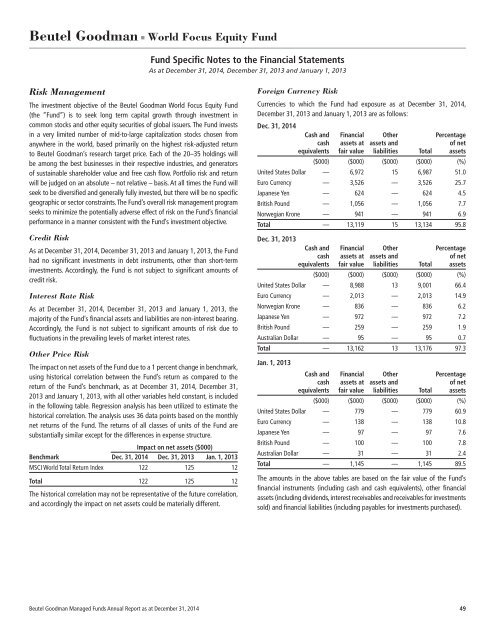
Foreign Currency Risk<br />
Currencies to which the Fund had exposure as at December 31, 2014,<br />
December 31, 2013 and January 1, 2013 are as follows:<br />
Dec. 31, 2014<br />
Cash and Financial Other Percentage<br />
cash assets at assets and of net<br />
equivalents fair value liabilities Total assets<br />
($000) ($000) ($000) ($000) (%)<br />
United States Dollar — 6,972 15 6,987 51.0<br />
Euro Currency — 3,526 — 3,526 25.7<br />
Japanese Yen — 624 — 624 4.5<br />
British Pound — 1,056 — 1,056 7.7<br />
Norwegian Krone — 941 — 941 6.9<br />
Total — 13,119 15 13,134 95.8<br />
Dec. 31, 2013<br />
Cash and Financial Other Percentage<br />
cash assets at assets and of net<br />
equivalents fair value liabilities Total assets<br />
($000) ($000) ($000) ($000) (%)<br />
United States Dollar — 8,988 13 9,001 66.4<br />
Euro Currency — 2,013 — 2,013 14.9<br />
Norwegian Krone — 836 — 836 6.2<br />
Japanese Yen — 972 — 972 7.2<br />
British Pound — 259 — 259 1.9<br />
Australian Dollar — 95 — 95 0.7<br />
Total — 13,162 13 13,176 97.3<br />
Jan. 1, 2013<br />
Cash and Financial Other Percentage<br />
cash assets at assets and of net<br />
equivalents fair value liabilities Total assets<br />
($000) ($000) ($000) ($000) (%)<br />
United States Dollar — 779 — 779 60.9<br />
Euro Currency — 138 — 138 10.8<br />
Japanese Yen — 97 — 97 7.6<br />
British Pound — 100 — 100 7.8<br />
Australian Dollar — 31 — 31 2.4<br />
Total — 1,145 — 1,145 89.5<br />
The amounts in the above tables are based on the fair value of the Fund’s<br />
financial instruments (including cash and cash equivalents), other financial<br />
assets (including dividends, interest receivables and receivables for investments<br />
sold) and financial liabilities (including payables for investments purchased).<br />
Beutel Goodman Managed Funds Annual Report as at December 31, 2014 49