

BEUTEL GOODMAN MANAGED FUNDS
Annual Financial Report - Beutel, Goodman & Company Ltd.
Annual Financial Report - Beutel, Goodman & Company Ltd.

You also want an ePaper? Increase the reach of your titles
YUMPU automatically turns print PDFs into web optimized ePapers that Google loves.
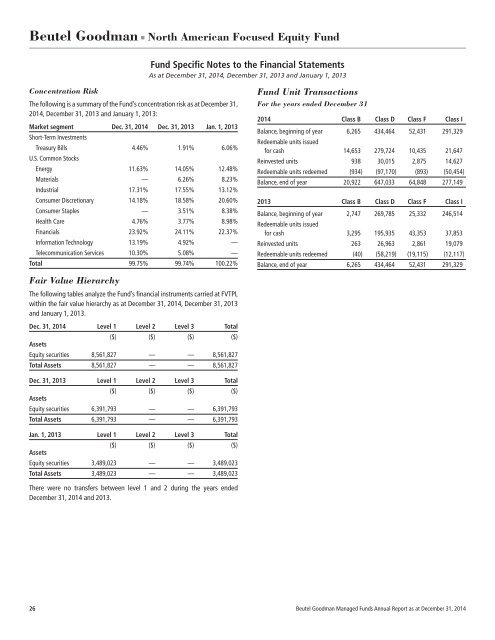
Beutel Goodman ■ North American Focused Equity Fund<br />
Fund Specific Notes to the Financial Statements<br />
As at December 31, 2014, December 31, 2013 and January 1, 2013<br />
Concentration Risk<br />
The following is a summary of the Fund’s concentration risk as at December 31,<br />
2014, December 31, 2013 and January 1, 2013:<br />
Market segment Dec. 31, 2014 Dec. 31, 2013 Jan. 1, 2013<br />
Short-Term Investments<br />
Treasury Bills 4.46% 1.91% 6.06%<br />
U.S. Common Stocks<br />
Energy 11.63% 14.05% 12.48%<br />
Materials — 6.26% 8.23%<br />
Industrial 17.31% 17.55% 13.12%<br />
Consumer Discretionary 14.18% 18.58% 20.60%<br />
Consumer Staples — 3.51% 8.38%<br />
Health Care 4.76% 3.77% 8.98%<br />
Financials 23.92% 24.11% 22.37%<br />
Information Technology 13.19% 4.92% —<br />
Telecommunication Services 10.30% 5.08% —<br />
Total 99.75% 99.74% 100.22%<br />
Fund Unit Transactions<br />
For the years ended December 31<br />
2014 Class B Class D Class F Class I<br />
Balance, beginning of year 6,265 434,464 52,431 291,329<br />
Redeemable units issued<br />
for cash 14,653 279,724 10,435 21,647<br />
Reinvested units 938 30,015 2,875 14,627<br />
Redeemable units redeemed (934) (97,170) (893) (50,454)<br />
Balance, end of year 20,922 647,033 64,848 277,149<br />
2013 Class B Class D Class F Class I<br />
Balance, beginning of year 2,747 269,785 25,332 246,514<br />
Redeemable units issued<br />
for cash 3,295 195,935 43,353 37,853<br />
Reinvested units 263 26,963 2,861 19,079<br />
Redeemable units redeemed (40) (58,219) (19,115) (12,117)<br />
Balance, end of year 6,265 434,464 52,431 291,329<br />
Fair Value Hierarchy<br />
The following tables analyze the Fund’s financial instruments carried at FVTPL<br />
within the fair value hierarchy as at December 31, 2014, December 31, 2013<br />
and January 1, 2013.<br />
Dec. 31, 2014 Level 1 Level 2 Level 3 Total<br />
($) ($) ($) ($)<br />
Assets<br />
Equity securities 8,561,827 — — 8,561,827<br />
Total Assets 8,561,827 — — 8,561,827<br />
Dec. 31, 2013 Level 1 Level 2 Level 3 Total<br />
($) ($) ($) ($)<br />
Assets<br />
Equity securities 6,391,793 — — 6,391,793<br />
Total Assets 6,391,793 — — 6,391,793<br />
Jan. 1, 2013 Level 1 Level 2 Level 3 Total<br />
($) ($) ($) ($)<br />
Assets<br />
Equity securities 3,489,023 — — 3,489,023<br />
Total Assets 3,489,023 — — 3,489,023<br />
There were no transfers between level 1 and 2 during the years ended<br />
December 31, 2014 and 2013.<br />
26 Beutel Goodman Managed Funds Annual Report as at December 31, 2014