

BEUTEL GOODMAN MANAGED FUNDS
Annual Financial Report - Beutel, Goodman & Company Ltd.
Annual Financial Report - Beutel, Goodman & Company Ltd.

Create successful ePaper yourself
Turn your PDF publications into a flip-book with our unique Google optimized e-Paper software.
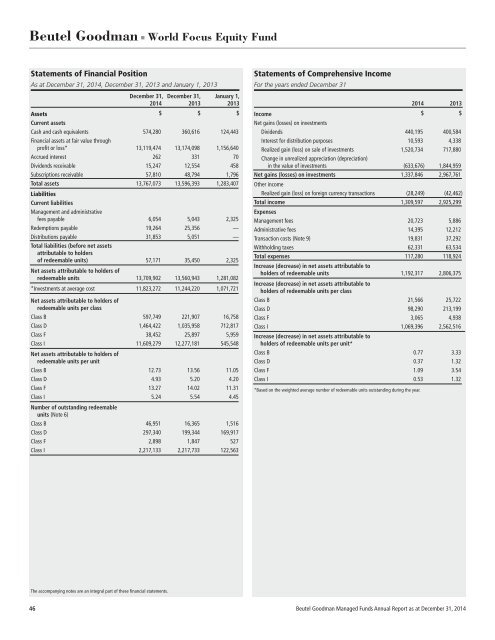
Beutel Goodman ■ World Focus Equity Fund<br />
Statements of Financial Position<br />
As at December 31, 2014, December 31, 2013 and January 1, 2013<br />
December 31, December 31, January 1,<br />
2014 2013 2013<br />
Assets<br />
$ $ $<br />
Current assets<br />
Cash and cash equivalents 574,280 360,616 124,443<br />
Financial assets at fair value through<br />
profit or loss* 13,119,474 13,174,098 1,156,640<br />
Accrued interest 262 331 70<br />
Dividends receivable 15,247 12,554 458<br />
Subscriptions receivable 57,810 48,794 1,796<br />
Total assets 13,767,073 13,596,393 1,283,407<br />
Liabilities<br />
Current liabilities<br />
Management and administrative<br />
fees payable 6,054 5,043 2,325<br />
Redemptions payable 19,264 25,356 —<br />
Distributions payable 31,853 5,051 —<br />
Total liabilities (before net assets<br />
attributable to holders<br />
of redeemable units) 57,171 35,450 2,325<br />
Net assets attributable to holders of<br />
redeemable units 13,709,902 13,560,943 1,281,082<br />
*Investments at average cost 11,823,272 11,244,220 1,071,721<br />
Net assets attributable to holders of<br />
redeemable units per class<br />
Class B 597,749 221,907 16,758<br />
Class D 1,464,422 1,035,958 712,817<br />
Class F 38,452 25,897 5,959<br />
Class I 11,609,279 12,277,181 545,548<br />
Net assets attributable to holders of<br />
redeemable units per unit<br />
Class B 12.73 13.56 11.05<br />
Class D 4.93 5.20 4.20<br />
Class F 13.27 14.02 11.31<br />
Class I 5.24 5.54 4.45<br />
Number of outstanding redeemable<br />
units (Note 6)<br />
Class B 46,951 16,365 1,516<br />
Class D 297,340 199,344 169,917<br />
Class F 2,898 1,847 527<br />
Class I 2,217,133 2,217,733 122,563<br />
Statements of Comprehensive Income<br />
For the years ended December 31<br />
Income<br />
Net gains (losses) on investments<br />
2014 2013<br />
$ $<br />
Dividends 440,195 400,584<br />
Interest for distribution purposes 10,593 4,338<br />
Realized gain (loss) on sale of investments 1,520,734 717,880<br />
Change in unrealized appreciation (depreciation)<br />
in the value of investments (633,676) 1,844,959<br />
Net gains (losses) on investments 1,337,846 2,967,761<br />
Other income<br />
Realized gain (loss) on foreign currency transactions (28,249) (42,462)<br />
Total income 1,309,597 2,925,299<br />
Expenses<br />
Management fees 20,723 5,886<br />
Administrative fees 14,395 12,212<br />
Transaction costs (Note 9) 19,831 37,292<br />
Withholding taxes 62,331 63,534<br />
Total expenses 117,280 118,924<br />
Increase (decrease) in net assets attributable to<br />
holders of redeemable units 1,192,317 2,806,375<br />
Increase (decrease) in net assets attributable to<br />
holders of redeemable units per class<br />
Class B 21,566 25,722<br />
Class D 98,290 213,199<br />
Class F 3,065 4,938<br />
Class I 1,069,396 2,562,516<br />
Increase (decrease) in net assets attributable to<br />
holders of redeemable units per unit*<br />
Class B 0.77 3.33<br />
Class D 0.37 1.32<br />
Class F 1.09 3.54<br />
Class I 0.53 1.32<br />
*Based on the weighted average number of redeemable units outstanding during the year.<br />
The accompanying notes are an integral part of these financial statements.<br />
46 Beutel Goodman Managed Funds Annual Report as at December 31, 2014