

BEUTEL GOODMAN MANAGED FUNDS
Annual Financial Report - Beutel, Goodman & Company Ltd.
Annual Financial Report - Beutel, Goodman & Company Ltd.

Create successful ePaper yourself
Turn your PDF publications into a flip-book with our unique Google optimized e-Paper software.
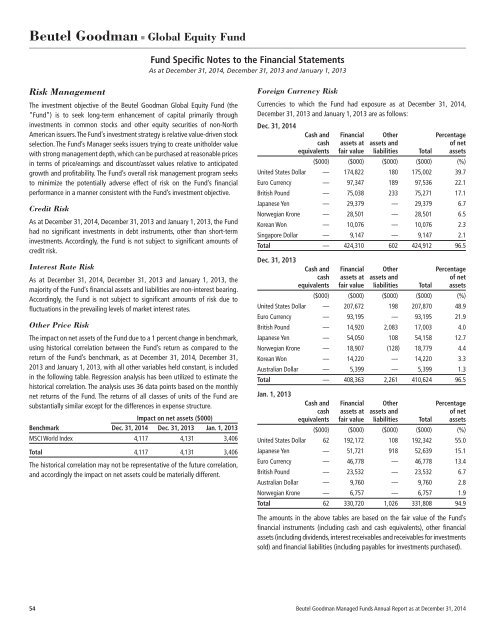
Beutel Goodman ■ Global Equity Fund<br />
Fund Specific Notes to the Financial Statements<br />
As at December 31, 2014, December 31, 2013 and January 1, 2013<br />
Risk Management<br />
The investment objective of the Beutel Goodman Global Equity Fund (the<br />
“Fund”) is to seek long-term enhancement of capital primarily through<br />
investments in common stocks and other equity securities of non-North<br />
American issuers. The Fund’s investment strategy is relative value-driven stock<br />
selection. The Fund’s Manager seeks issuers trying to create unitholder value<br />
with strong management depth, which can be purchased at reasonable prices<br />
in terms of price/earnings and discount/asset values relative to anticipated<br />
growth and profitability. The Fund’s overall risk management program seeks<br />
to minimize the potentially adverse effect of risk on the Fund’s financial<br />
performance in a manner consistent with the Fund’s investment objective.<br />
Credit Risk<br />
As at December 31, 2014, December 31, 2013 and January 1, 2013, the Fund<br />
had no significant investments in debt instruments, other than short-term<br />
investments. Accordingly, the Fund is not subject to significant amounts of<br />
credit risk.<br />
Interest Rate Risk<br />
As at December 31, 2014, December 31, 2013 and January 1, 2013, the<br />
majority of the Fund’s financial assets and liabilities are non-interest bearing.<br />
Accordingly, the Fund is not subject to significant amounts of risk due to<br />
fluctuations in the prevailing levels of market interest rates.<br />
Other Price Risk<br />
The impact on net assets of the Fund due to a 1 percent change in benchmark,<br />
using historical correlation between the Fund’s return as compared to the<br />
return of the Fund’s benchmark, as at December 31, 2014, December 31,<br />
2013 and January 1, 2013, with all other variables held constant, is included<br />
in the following table. Regression analysis has been utilized to estimate the<br />
historical correlation. The analysis uses 36 data points based on the monthly<br />
net returns of the Fund. The returns of all classes of units of the Fund are<br />
substantially similar except for the differences in expense structure.<br />
Impact on net assets ($000)<br />
Benchmark Dec. 31, 2014 Dec. 31, 2013 Jan. 1, 2013<br />
MSCI World Index 4,117 4,131 3,406<br />
Total 4,117 4,131 3,406<br />
The historical correlation may not be representative of the future correlation,<br />
and accordingly the impact on net assets could be materially different.<br />
Foreign Currency Risk<br />
Currencies to which the Fund had exposure as at December 31, 2014,<br />
December 31, 2013 and January 1, 2013 are as follows:<br />
Dec. 31, 2014<br />
Cash and Financial Other Percentage<br />
cash assets at assets and of net<br />
equivalents fair value liabilities Total assets<br />
($000) ($000) ($000) ($000) (%)<br />
United States Dollar — 174,822 180 175,002 39.7<br />
Euro Currency — 97,347 189 97,536 22.1<br />
British Pound — 75,038 233 75,271 17.1<br />
Japanese Yen — 29,379 — 29,379 6.7<br />
Norwegian Krone — 28,501 — 28,501 6.5<br />
Korean Won — 10,076 — 10,076 2.3<br />
Singapore Dollar — 9,147 — 9,147 2.1<br />
Total — 424,310 602 424,912 96.5<br />
Dec. 31, 2013<br />
Cash and Financial Other Percentage<br />
cash assets at assets and of net<br />
equivalents fair value liabilities Total assets<br />
($000) ($000) ($000) ($000) (%)<br />
United States Dollar — 207,672 198 207,870 48.9<br />
Euro Currency — 93,195 — 93,195 21.9<br />
British Pound — 14,920 2,083 17,003 4.0<br />
Japanese Yen — 54,050 108 54,158 12.7<br />
Norwegian Krone — 18,907 (128) 18,779 4.4<br />
Korean Won — 14,220 — 14,220 3.3<br />
Australian Dollar — 5,399 — 5,399 1.3<br />
Total — 408,363 2,261 410,624 96.5<br />
Jan. 1, 2013<br />
Cash and Financial Other Percentage<br />
cash assets at assets and of net<br />
equivalents fair value liabilities Total assets<br />
($000) ($000) ($000) ($000) (%)<br />
United States Dollar 62 192,172 108 192,342 55.0<br />
Japanese Yen — 51,721 918 52,639 15.1<br />
Euro Currency — 46,778 — 46,778 13.4<br />
British Pound — 23,532 — 23,532 6.7<br />
Australian Dollar — 9,760 — 9,760 2.8<br />
Norwegian Krone — 6,757 — 6,757 1.9<br />
Total 62 330,720 1,026 331,808 94.9<br />
The amounts in the above tables are based on the fair value of the Fund’s<br />
financial instruments (including cash and cash equivalents), other financial<br />
assets (including dividends, interest receivables and receivables for investments<br />
sold) and financial liabilities (including payables for investments purchased).<br />
54 Beutel Goodman Managed Funds Annual Report as at December 31, 2014