

BEUTEL GOODMAN MANAGED FUNDS
Annual Financial Report - Beutel, Goodman & Company Ltd.
Annual Financial Report - Beutel, Goodman & Company Ltd.

Create successful ePaper yourself
Turn your PDF publications into a flip-book with our unique Google optimized e-Paper software.
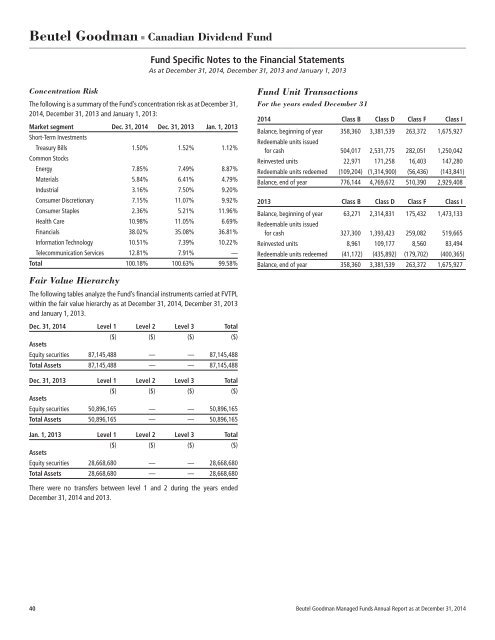
Beutel Goodman ■ Canadian Dividend Fund<br />
Fund Specific Notes to the Financial Statements<br />
As at December 31, 2014, December 31, 2013 and January 1, 2013<br />
Concentration Risk<br />
The following is a summary of the Fund’s concentration risk as at December 31,<br />
2014, December 31, 2013 and January 1, 2013:<br />
Market segment Dec. 31, 2014 Dec. 31, 2013 Jan. 1, 2013<br />
Short-Term Investments<br />
Treasury Bills 1.50% 1.52% 1.12%<br />
Common Stocks<br />
Energy 7.85% 7.49% 8.87%<br />
Materials 5.84% 6.41% 4.79%<br />
Industrial 3.16% 7.50% 9.20%<br />
Consumer Discretionary 7.15% 11.07% 9.92%<br />
Consumer Staples 2.36% 5.21% 11.96%<br />
Health Care 10.98% 11.05% 6.69%<br />
Financials 38.02% 35.08% 36.81%<br />
Information Technology 10.51% 7.39% 10.22%<br />
Telecommunication Services 12.81% 7.91% —<br />
Total 100.18% 100.63% 99.58%<br />
Fund Unit Transactions<br />
For the years ended December 31<br />
2014 Class B Class D Class F Class I<br />
Balance, beginning of year 358,360 3,381,539 263,372 1,675,927<br />
Redeemable units issued<br />
for cash 504,017 2,531,775 282,051 1,250,042<br />
Reinvested units 22,971 171,258 16,403 147,280<br />
Redeemable units redeemed (109,204) (1,314,900) (56,436) (143,841)<br />
Balance, end of year 776,144 4,769,672 510,390 2,929,408<br />
2013 Class B Class D Class F Class I<br />
Balance, beginning of year 63,271 2,314,831 175,432 1,473,133<br />
Redeemable units issued<br />
for cash 327,300 1,393,423 259,082 519,665<br />
Reinvested units 8,961 109,177 8,560 83,494<br />
Redeemable units redeemed (41,172) (435,892) (179,702) (400,365)<br />
Balance, end of year 358,360 3,381,539 263,372 1,675,927<br />
Fair Value Hierarchy<br />
The following tables analyze the Fund’s financial instruments carried at FVTPL<br />
within the fair value hierarchy as at December 31, 2014, December 31, 2013<br />
and January 1, 2013.<br />
Dec. 31, 2014 Level 1 Level 2 Level 3 Total<br />
($) ($) ($) ($)<br />
Assets<br />
Equity securities 87,145,488 — — 87,145,488<br />
Total Assets 87,145,488 — — 87,145,488<br />
Dec. 31, 2013 Level 1 Level 2 Level 3 Total<br />
($) ($) ($) ($)<br />
Assets<br />
Equity securities 50,896,165 — — 50,896,165<br />
Total Assets 50,896,165 — — 50,896,165<br />
Jan. 1, 2013 Level 1 Level 2 Level 3 Total<br />
($) ($) ($) ($)<br />
Assets<br />
Equity securities 28,668,680 — — 28,668,680<br />
Total Assets 28,668,680 — — 28,668,680<br />
There were no transfers between level 1 and 2 during the years ended<br />
December 31, 2014 and 2013.<br />
40 Beutel Goodman Managed Funds Annual Report as at December 31, 2014