

BEUTEL GOODMAN MANAGED FUNDS
Annual Financial Report - Beutel, Goodman & Company Ltd.
Annual Financial Report - Beutel, Goodman & Company Ltd.

You also want an ePaper? Increase the reach of your titles
YUMPU automatically turns print PDFs into web optimized ePapers that Google loves.
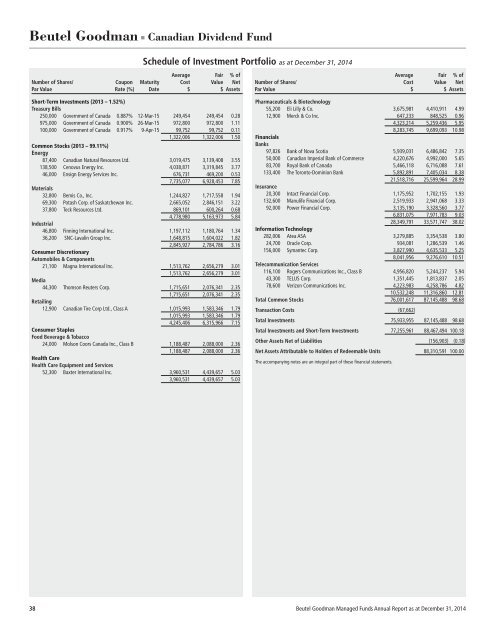
Beutel Goodman ■ Canadian Dividend Fund<br />
Schedule of Investment Portfolio as at December 31, 2014<br />
Average Fair % of<br />
Number of Shares/ Coupon Maturity Cost Value Net<br />
Par Value Rate (%) Date $ $ Assets<br />
Short-Term Investments (2013 – 1.52%)<br />
Treasury Bills<br />
250,000 Government of Canada 0.887% 12-Mar-15 249,454 249,454 0.28<br />
975,000 Government of Canada 0.900% 26-Mar-15 972,800 972,800 1.11<br />
100,000 Government of Canada 0.917% 9-Apr-15 99,752 99,752 0.11<br />
1,322,006 1,322,006 1.50<br />
Common Stocks (2013 – 99.11%)<br />
Energy<br />
87,400 Canadian Natural Resources Ltd. 3,019,475 3,139,408 3.55<br />
138,500 Cenovus Energy Inc. 4,038,871 3,319,845 3.77<br />
46,000 Ensign Energy Services Inc. 676,731 469,200 0.53<br />
7,735,077 6,928,453 7.85<br />
Materials<br />
32,800 Bemis Co., Inc. 1,244,827 1,717,558 1.94<br />
69,300 Potash Corp. of Saskatchewan Inc. 2,665,052 2,846,151 3.22<br />
37,800 Teck Resources Ltd. 869,101 600,264 0.68<br />
4,778,980 5,163,973 5.84<br />
Industrial<br />
46,800 Finning International Inc. 1,197,112 1,180,764 1.34<br />
36,200 SNC-Lavalin Group Inc. 1,648,815 1,604,022 1.82<br />
2,845,927 2,784,786 3.16<br />
Consumer Discretionary<br />
Automobiles & Components<br />
21,100 Magna International Inc. 1,513,762 2,656,279 3.01<br />
1,513,762 2,656,279 3.01<br />
Media<br />
44,300 Thomson Reuters Corp. 1,715,651 2,076,341 2.35<br />
1,715,651 2,076,341 2.35<br />
Retailing<br />
12,900 Canadian Tire Corp Ltd., Class A 1,015,993 1,583,346 1.79<br />
1,015,993 1,583,346 1.79<br />
4,245,406 6,315,966 7.15<br />
Consumer Staples<br />
Food Beverage & Tobacco<br />
24,000 Molson Coors Canada Inc., Class B 1,188,487 2,088,000 2.36<br />
1,188,487 2,088,000 2.36<br />
Health Care<br />
Health Care Equipment and Services<br />
52,300 Baxter International Inc. 3,960,531 4,439,657 5.03<br />
3,960,531 4,439,657 5.03<br />
Average Fair % of<br />
Number of Shares/ Cost Value Net<br />
Par Value $ $ Assets<br />
Pharmaceuticals & Biotechnology<br />
55,200 Eli Lilly & Co. 3,675,981 4,410,911 4.99<br />
12,900 Merck & Co Inc. 647,233 848,525 0.96<br />
4,323,214 5,259,436 5.95<br />
8,283,745 9,699,093 10.98<br />
Financials<br />
Banks<br />
97,826 Bank of Nova Scotia 5,939,031 6,486,842 7.35<br />
50,000 Canadian Imperial Bank of Commerce 4,220,676 4,992,000 5.65<br />
83,700 Royal Bank of Canada 5,466,118 6,716,088 7.61<br />
133,400 The Toronto-Dominion Bank 5,892,891 7,405,034 8.38<br />
21,518,716 25,599,964 28.99<br />
Insurance<br />
20,300 Intact Financial Corp. 1,175,952 1,702,155 1.93<br />
132,600 Manulife Financial Corp. 2,519,933 2,941,068 3.33<br />
92,000 Power Financial Corp. 3,135,190 3,328,560 3.77<br />
6,831,075 7,971,783 9.03<br />
28,349,791 33,571,747 38.02<br />
Information Technology<br />
282,006 Atea ASA 3,279,885 3,354,538 3.80<br />
24,700 Oracle Corp. 934,081 1,286,539 1.46<br />
156,000 Symantec Corp. 3,827,990 4,635,533 5.25<br />
8,041,956 9,276,610 10.51<br />
Telecommunication Services<br />
116,100 Rogers Communications Inc., Class B 4,956,820 5,244,237 5.94<br />
43,300 TELUS Corp. 1,351,445 1,813,837 2.05<br />
78,600 Verizon Communications Inc. 4,223,983 4,258,786 4.82<br />
10,532,248 11,316,860 12.81<br />
Total Common Stocks 76,001,617 87,145,488 98.68<br />
Transaction Costs (67,662)<br />
Total Investments 75,933,955 87,145,488 98.68<br />
Total Investments and Short-Term Investments 77,255,961 88,467,494 100.18<br />
Other Assets Net of Liabilities (156,903) (0.18)<br />
Net Assets Attributable to Holders of Redeemable Units 88,310,591 100.00<br />
The accompanying notes are an integral part of these financial statements.<br />
38 Beutel Goodman Managed Funds Annual Report as at December 31, 2014